

Health Impacts from Wildfires in 2021 Over North America
In the summer of 2021, an intense heat wave in June lead to an earlier than normal start to the North American wildfire season with several large burned areas in western Canada and the Pacific Northwest states in June and later in the season wildfires spread throughout western US and into central Canada. Smoke from wildfires contains a mix of both natural and anthropogenic burnt material and gases suspended in the air which are known to be unhealthy for human health. This smoke – a mix of chemical species – while likely the most concentrated near the wildfire, can be transported over long distances depending on the meteorological conditions and composition of the air, impacting air quality for large areas of North America. The atmospheric chemistry within a smoke plume is complex: Close to the fire, fine particulate matter (PM2.5) and nitrogen oxides (NOx) concentrations are expected to be high as they are directly emitted by the fires, and actually reduce ozone (O3) through chemical reactions with NOx; as the smoke moves away from the fire source, ozone is produced and can raise the background concentrations to levels comparable with urban pollution.
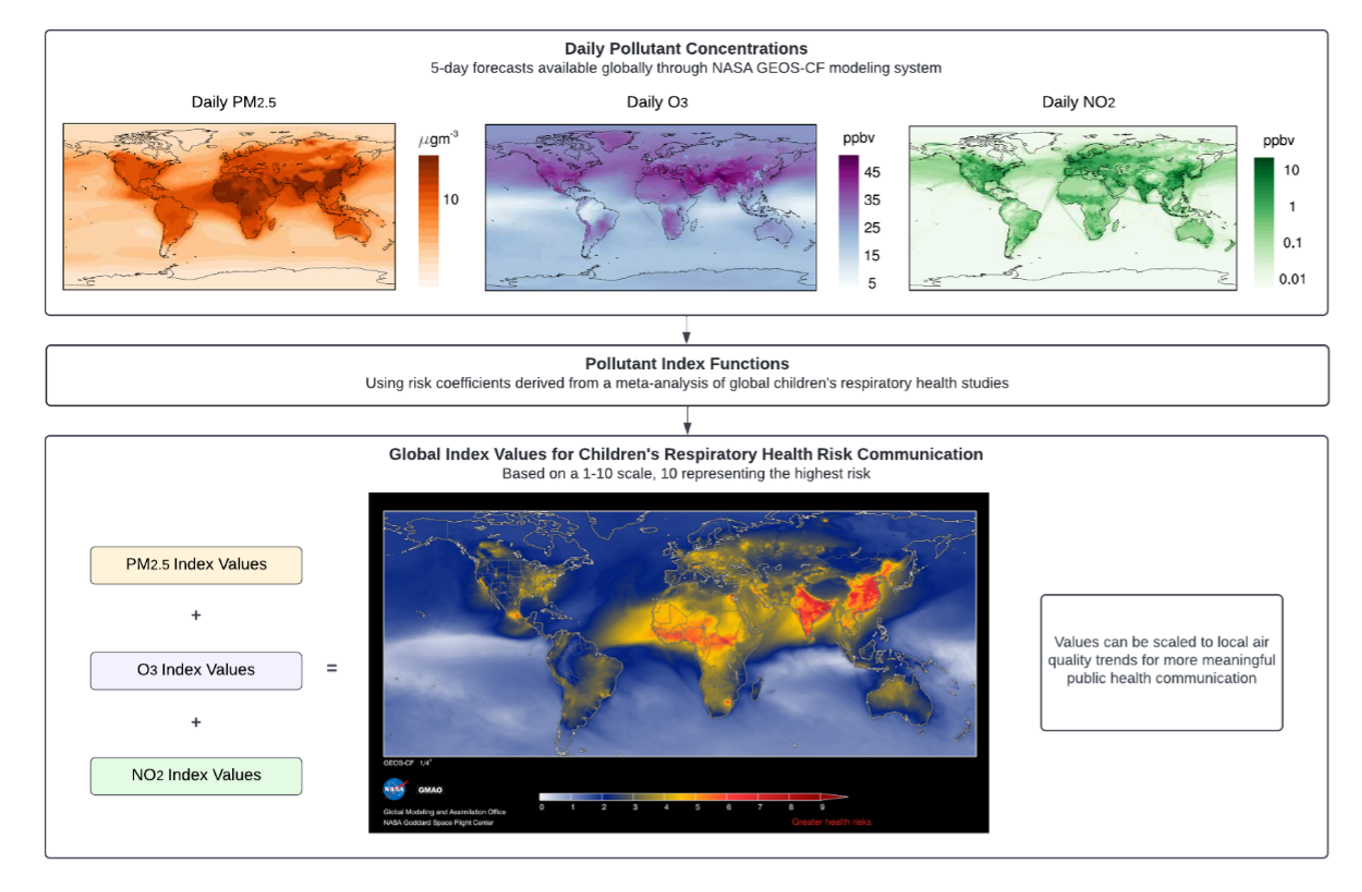
Each of these pollutants can be estimated using NASA’s GEOS atmospheric composition forecast system (GEOS-CF; Keller et al., 2021), providing global air pollution estimates at a roughly 25 × 25 km2 horizontal spatial resolution. In contrast to ground-level monitoring instruments, which are traditionally placed in high-population urban centers, air quality models provide uniform, high-resolution estimates of pollutant concentrations across the earth’s surface. This is especially important in the context of wildfires, which heavily impact unmonitored rural communities.
The spatial distribution of adverse health risks attributable to wildfires in North America was evaluated for the World Meteorological Organization Air Quality and Climate Bulletin for 2022 with a multi-pollutant health-based air quality index designed to communicate children‘s respiratory risk (Gladson et al., 2022). Air quality indices are tools used to represent complex pollution hazards through a single numerical value, and most accurately reflect real-world conditions when based on measured health risk associations from multiple air pollutants (Stieb et al., 2012; Li et al., 2017; Perlmutt & Cromar, 2019). The global index used in this analysis follows this model by incorporating risk ratios from a meta-analysis of global epidemiological studies on air quality and respiratory morbidity in children, who are particularly susceptible to the adverse health impacts from wildfire smoke (Henry et al., 2021).
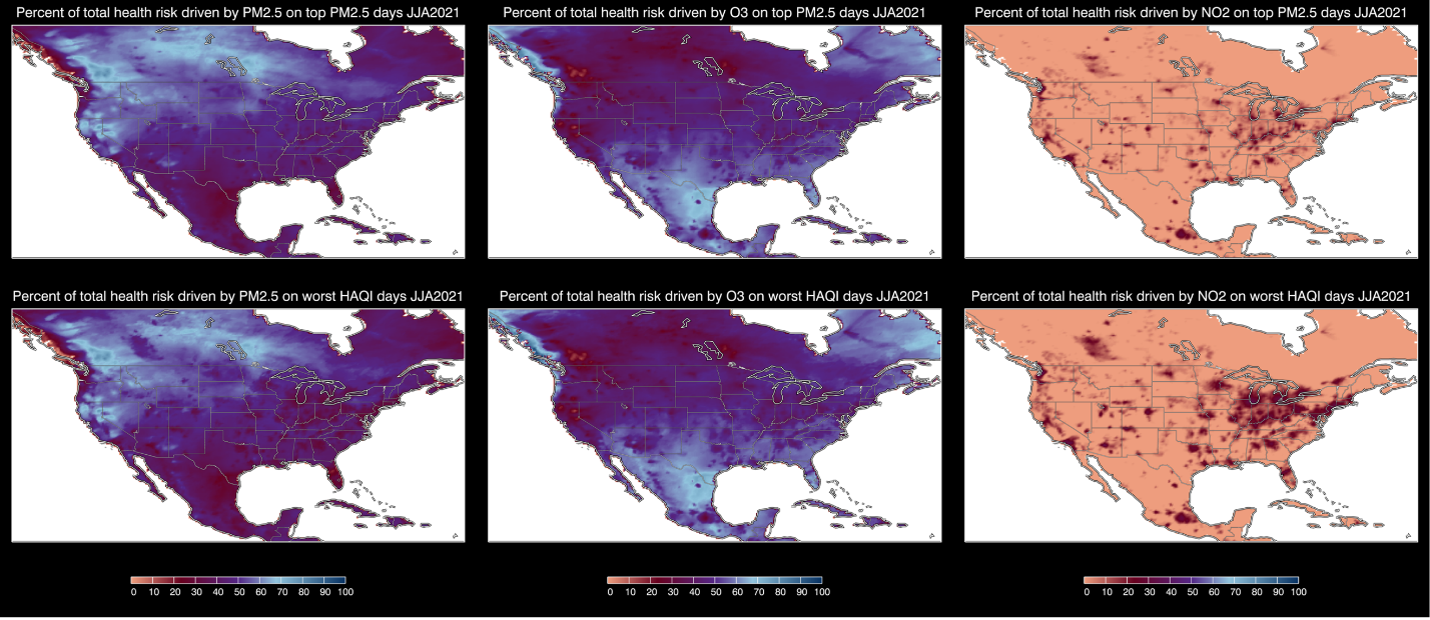
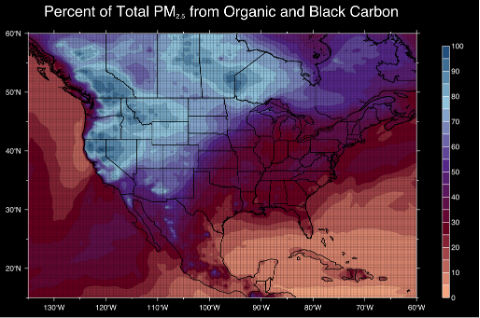
For this analysis, historical estimates from the GEOS-CF model for daily-average PM2.5, daily-average nitrogen dioxide (NO2), and the maximum daily 8-hour average O3 were run through this global index function to produce daily index values at a 25 × 25 km2 horizontal resolution (see workflow schematic in Figure 1) for the North American continent during June, July, and August of 2021. The percent of total health risks driven by each of the three pollutants was assessed 1) on days when the daily-average PM2.5 was greater than the 95th percentile (n=5 days), and 2) on days when the health-based air quality index was greater than the 95th percentile (see Figure 2). As demonstrated in the WMO’s Bulletin, wildfire smoke was likely the dominate source for PM2.5 in summer 2021 (see their Figure 2). This is demonstrated here by the percent of the total PM2.5 associated with organic and black carbon, which are good indicators for wildfire smoke, as simulated by GEOS-CF model (Figure 3).
Furthermore, this analysis found that extreme PM2.5 concentrations over North America during summer of 2021, largely driven by wildland fire emissions (Figure 3), are associated with the highest respiratory morbidity risks (up to 90%) among children in parts of western and northern North America (Figure 2, left). Emission sources other than wildland fires (i.e., urban anthropogenic sources) with higher compositions of gaseous pollutants (O3 and NO2) also make up sizable percentages of children’s total respiratory health risk from air pollution across the continent (Figure 2, middle and right panels) even during extreme fire events (top row). O3 drives the majority of total health risks in the southern regions of North America, while the largest NO2 contributions (up to 30% of total health risk) are centralized in metropolitan areas across the continent. NO2 contributions to total risk are attenuated when PM2.5 concentrations are highest (Figure 2, right), highlighting how PM2.5 dominates health impacts continent-wide during the most intense fire periods.
Due to a century of fire suppression management practices (Schweizer & Cisneros, 2017) and human-induced climate change (Kirchmeier-Young et al., 2018), fire seasons are expected to increase in length and intensity. With this, the relative contributions of each fire-derived pollutant observed in this analysis will likely continue to evolve. Global air quality models like GEOS-CF can help mitigate the health impacts of these changing pollution profiles by providing near real-time, high-resolution data to inform local air quality management practices and efforts to communicate air quality information to the public, especially to parents of children with respiratory conditions.
References:
Gladson, L.A., Cromar, K.R., Ghazipura, M., Knowland, K.E., Keller, C.A., and Duncan, B. 2022. Communicating respiratory health risk among children using a global air quality index. Environmental International, 159 (107023): [10.1016/j.envint.2021.107023]
Henry, S., Ospina, M.B., Dennett, L., and Hicks, A. 2021. Assessing the Risk of Respiratory-Related Healthcare Visits Associated with Wildfire Smoke Exposure in Children 0–18 Years Old: A Systematic Review. Int. J. Environ. Res. Public Health, 18 (8799): [10.3390/ijerph18168799]
Keller, C.A., Knowland, K.E., Duncan, B.N., Liu, J., Anderson, D.C., Das, S., Lucchesi, R.A., Lundgren, E.W., Nicely, J.M., Nielsen, E., et al. 2021. Description of the NASA GEOS Composition Forecast Modeling System GEOS-CF v1.0. J Adv Model Earth Syst, 13: [10.1029/2020MS002413]
Kirchmeier-Young, M.C., Gillett, N.P., Zwiers, F.W., Cannon, A.J., and Anslow, F.S. 2019. Attribution of the Influence of Human-Induced Climate Change on an Extreme Fire Season. Earth's Future, 7: [10.1029/2018EF001050]
Perlmutt, L.D. and Cromar, K.R. 2019. Comparing associations of respiratory risk for the EPA Air Quality Index and health-based air quality indices. Atmospheric Environment, 202(10): [10.1016/j.atmosenv.2019.01.011]
Li, X., Xiao, J., Lin, H., Liu, T., Qian, Z., Zeng, W., Guo, L., and Ma, W. 2017. The construction and validity analysis of AQHI based on mortality risk: A case study in Guangzhou, China. Environmental Pollution, 220(Pt A): [10.1016/j.envpol.2016.09.091]
Schweizer, D.W. and Cisneros, R. 2017. Forest fire policy: change conventional thinking of smoke management to prioritize long-term air quality and public health. Air Qual. Atmos. Health, 10: [10.1007/s11869-016-0405-4]
Stieb, D.M., Burnett, R.T., Smith-Doiron, M., Brion, O., Shin, H.H., and Economou, V. 2008. A New Multipollutant, No-Threshold Air Quality Health Index Based on Short-Term Associations Observed in Daily Time-Series Analyses. Journal of the Air & Waste Management Association, 58(3): [10.3155/1047-3289.58.3.435]