

An Early Start to the North American Biomass Burning Season in 2021
In the wake of the heatwave event in the Pacific Northwest and western Canada in late June 2021, wildfires erupted. The conditions for these fires were primed by the extreme heat, which exacerbated the long-standing drought conditions in the region. The most notable fire is the Bootleg Fire, spanning hundreds of thousands of acres in southern Oregon; furthermore, additional fires during the first half of July were also prevalent in California, Idaho, Montana, and parts of western and central Canada. Smoke associated with wildfires contains particulate matter, or aerosols, that can be harmful to human health. Several of the pollutants that are emitted from wildfires are represented in GEOS FP: this report focuses on the black carbon (BC) and organic carbon (OC).
Immediately following the recession of the late June high pressure and extreme heat from western North America (See https://gmao.gsfc.nasa.gov/research/science_snapshots/2021/nw_heatwave_june2021.php), the North American wildfire season got off to a strong start with notable wildfires in British Columbia beginning July 1. As the heat dome exited to the east in early July, wildfires sparked in eastern Manitoba and western Ontario. Simultaneously, fires ignited in the western United States (U.S.) and these have since continued to expand in their extent. The pollutants emitted by these fires were transported eastward by the prevalent westerly winds and, in combination with emissions from other fires, air quality deteriorated across multiple U.S. states and Canadian provinces. After being transported thousands of miles, the smoke reached the U.S. east coast by July 20, giving the sky a milky appearance in large regions of the East Coast, and leading to severe air pollution in New York City (Figure 1).

These anomalous wildfire emissions differ in a key manner from those in previous years. In 2020, the late summer (August and September) wildfire emissions were exceptionally strong in the western United States (See https://gmao.gsfc.nasa.gov/research/science_snapshots/2021/n_hemi_fires_2020.php). In 2021, it is noteworthy that the growth of the pollutant emissions has outpaced that in prior years, because of the early onset of wildfire events (Figure 2).
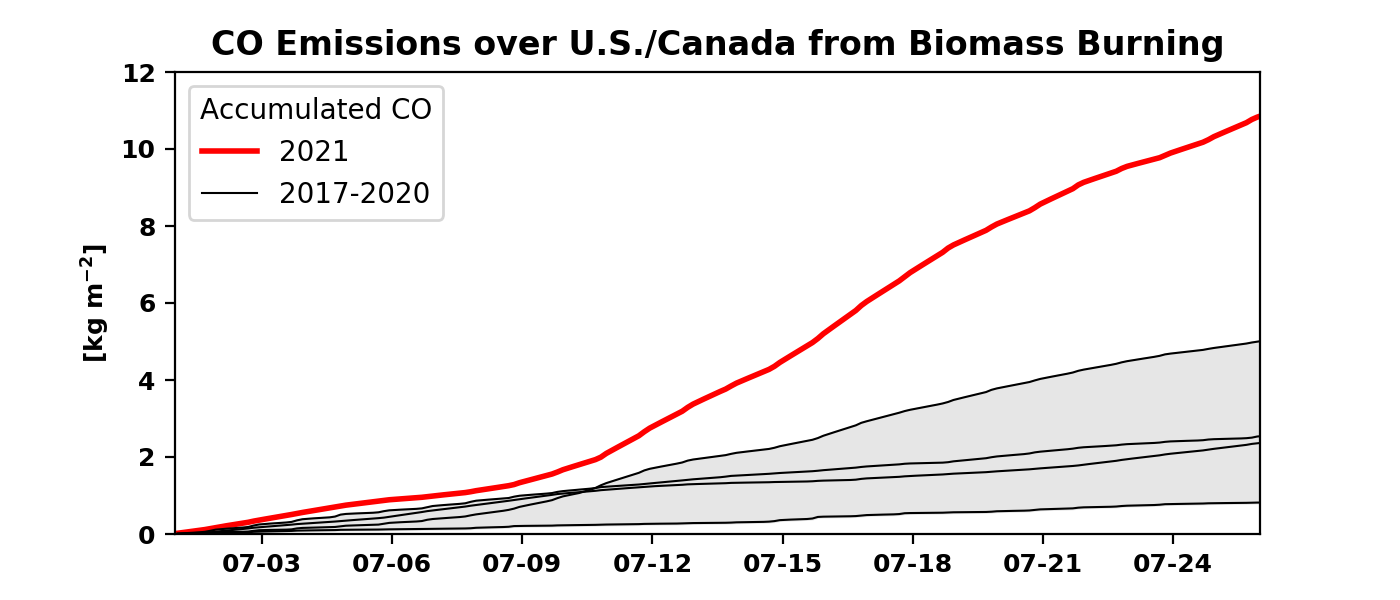
over the United States and Canada within the region of 30 °N – 75 °N and 135 °W and 60 °W.
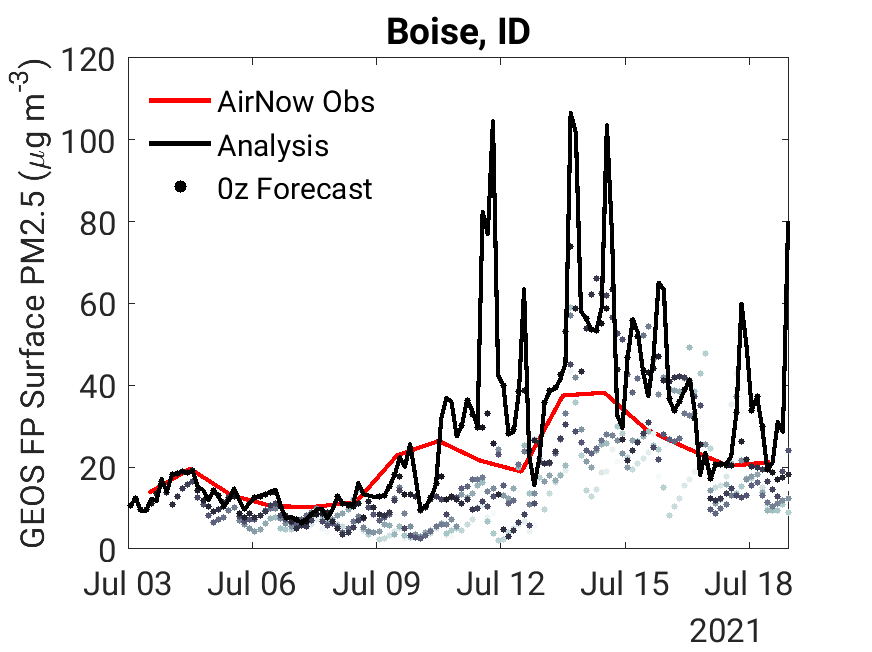
Since aerosols are suspended in the air, the particles can be breathed in and therefore have the potential to impact human health. The smaller the aerosol particle, the more likely it is to penetrate deep into the lungs and then into the blood stream impacting other biological systems. For this reason, particulate matter with a diameter less than 2.5 microns (PM2.5) is used as one of the metrics to define air quality. An example time series is shown for Boise, Idaho, an urban area which suffered from poor air quality (Figure 3). At the start of July, GEOS FP was able to accurately simulate current conditions and forecast the amount of PM2.5 as a result from the smoke from the wildfires in the region. However, beginning on July 10th, GEOS FP overestimated PM2.5 at the surface near Boise.
There are several reasons which could lead to the over prediction of PM2.5. Of most importance for this situation is a potential deficiency in the representation of the optical properties for black and organic carbon. Although aerosol optical depth—a total column integrated satellite measurement known to correlate with surface PM2.5—constrains the current GEOS FP estimates of aerosols, the mass of individual aerosol species is dependent on the GOCART aerosol module. Additionally, GEOS FP lacks the capability to loft wildfire aerosols high in the atmosphere due to localized convection caused by the fire’s extensive heat (a phenomena commonly referred to as pyrocumulus), which may result in aerosols accumulating near the surface in the model. Furthermore, it can often be noted that the forecasted PM2.5 is lower than the analyzed PM2.5 which is due to the persistence of biomass burning emissions through the forecast period.
GMAO Animation: Transport of Carbon Monoxide over U.S. and Canada from 01-26 July, 2021:
Caption: Column burden of carbon monoxide (CO) associated with biomass burning in North America in GEOS FP. CO is used as a proxy to designate to the location and strength of smoke plumes as it is a gaseous substance also emitted from wildfires.