

A Dynamical View of the Record Heatwave of June 2021 in Western North America
During the last week of June 2021, an unprecedented heat wave engulfed the US Pacific Northwest and adjacent province of British Columbia (BC), Canada. The highest ever recorded temperatures were reported in Portland, OR, on June 26, and in numerous other locations as the heat spread up the Western States. On June 28, the temperature reached 49.2° C in Lytton, BC: this is the highest value ever recorded in Canada.
The combination of extreme temperatures over multiple days and this region’s infrequent experience with such extreme heat resulted in several hundreds of excess deaths, the majority of which occurred in British Columbia. With almost twice as many deaths as would normally be expected in this few-day period, the heat wave is the most deadly natural disaster experienced in Canada since its formation in 1867.
The dynamical nature of this major heat event was captured in the Goddard Earth Observing System (GEOS) analyses and forecasts, emphasizing the relationship between near-surface temperatures and the upper air circulation which displayed the so-called “omega block” pattern. In an omega-block pattern, lines of equal height on a constant pressure chart resemble the Greek letter omega (Ω). Under the “bulge” of the omega, where the height anomalies are largest, the air sinks adiabatically; as it sinks, the air compresses and warms substantially, further increasing temperatures in the center of the high-pressure region. Such omega blocking situations typically persist for several days before they erode.
This situation is very prominent in the image, which shows the circulation at 2100UT (Universal Time), or near noon local time on the West Coast of North America. The exceedingly high surface air temperatures (greater than 30° C, or 86° F), purple dots, coincide with the pronounced high-pressure ridge over Western North America, which is depicted by the high geopotential height fields (white contours) that show the textbook Ω shape on the 200-hPa pressure level. The strong anticyclonic circulation highlighted by the shaded potential vorticity (PV) field, both shown for the 200-hPa pressure level which is about 12 km above the Earth’s surface (mean sea level).
GEOS Analysis: North American Heat Dome, June 30, 2021
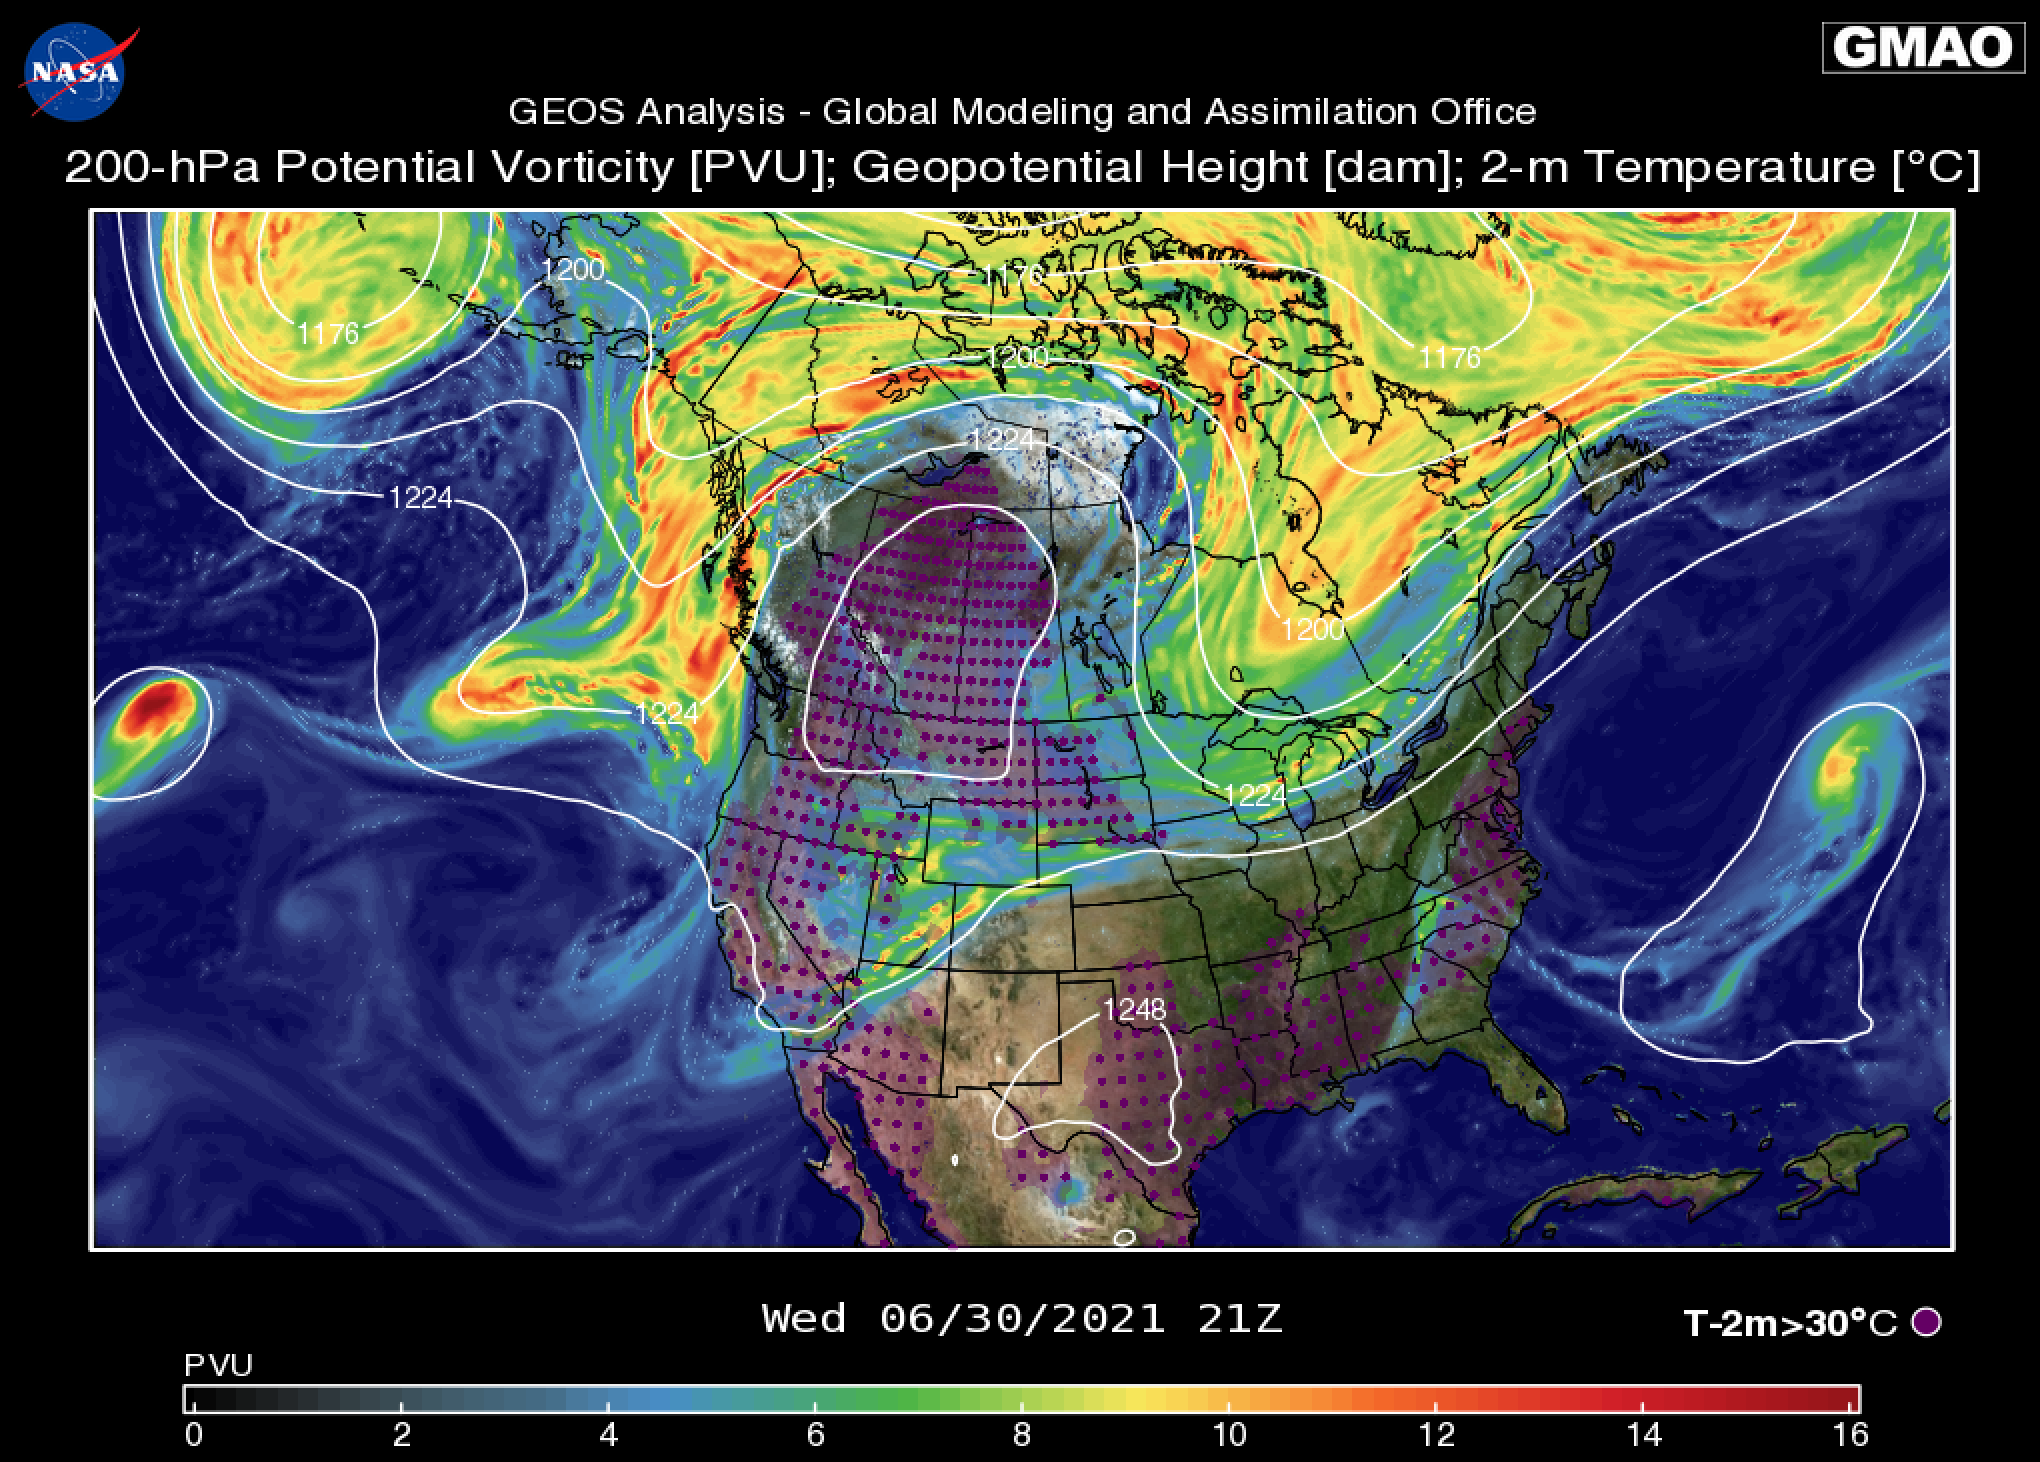
This dynamical pattern clearly depicts the alignment of the hot surface air with the upper tropospheric ridge, with low PV values that are typical of the subtropics pushing in to the high PV air mass associated with the high latitudes. The two ridges over the West and East coasts of North America sandwich a southward excursion of polar PV values over the central part of the continent, depicting a highly distorted jet stream pattern that dominated the flow and eventually contributed to severe weather events in the eastern US on June 30 and July 1.
The frequency of these extreme heat events is increasing (Schubert et al., 2014) in a manner consistent with large-scale responses to a warming planet. While these exceptionally high temperatures were clearly a consequence of an anomalous circulation event superimposed on the overall greenhouse gas induced warming of Earth, substantial research is needed to investigate the detailed causal mechanisms at work in this event and whether such heat domes are changing in frequency or magnitude as the planet heats.
The accompanying animations depict the evolution of the upper tropospheric dynamical (PV) field along with the warm near-surface air between June 18 and July 5, 2021. The first animation illustrates the progression of the extreme heat and the building up of the heat dome in the Northwestern US and Canada, highlighting the dynamical nature of the build up of the omega-blocking situation and the anomalous circulation over this region. The second animation provides a more quantitative view of the near-surface (two-meter altitude) temperatures for the same period.
Animation 1:
Animation 2:
References:
Schubert, S. D., H. Wang, R. Koster, M. Suarez, and P. Groisman, 2014. Northern Eurasian heat waves and droughts. J. Climate — Special Drought Edition, 27, 9, 3169-3207. 10.1175/JCLI-D-13-00360.1. Link to Published Version