

Was 2020 an exceptional year for fires in the Northern Hemisphere extratropics?
The 2020 wildfire season in the extratropical region of the Northern Hemisphere was marked by extreme fires in Siberia and the Western United States, and uncharacteristically weak fire activity in Alaska and Canada. Comparison with estimates of historical (2003 through 2019) fire emissions indicated that 2020 was an exceptional year in terms of the total amount of pyrogenic carbon released in the atmosphere by wildfires in Siberia and the Western United States.
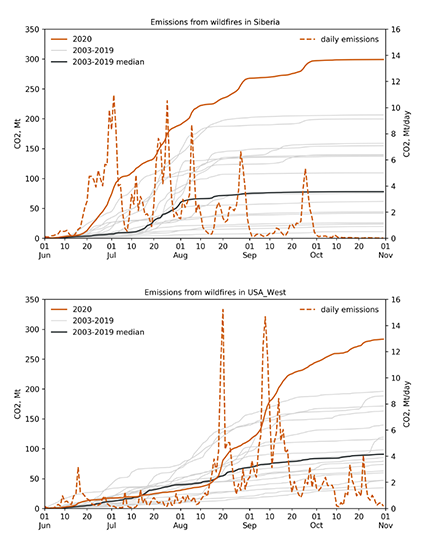
The wildfires in Siberia released about 300 Mt of carbon dioxide (CO2), or about 225 Mt more than the median value of the CO2 emissions from this region for the previous 17 years. For comparison, in 2019 and 2012, which were the years with the second and third highest fire emissions, about 200 Mt of CO2 were emitted by biomass burning. Time series of the regional fire emissions showed that the 2020 fire season was characterized by continuous and intensive burning with several well-defined episodes. The fire activity largely subsided by the end of September, making this season also exceptionally long — two to four weeks longer than it is typical for this region.
The amount of CO2 released from wildfires in the Western United States in 2020 was the highest on record since 2003. The 2020 fires emitted about 280 Mt-CO2, which is 200 Mt-CO2 more than the median value of total regional emissions for this region. Analysis of the daily and cumulative emissions showed that in June and July the fire activity was following the regional fire climatology, however this behavior changed abruptly in the middle of August when extreme fires caused large spike in the emissions, followed by another episode in September. Compared to the second and third highest ranking 2012 and 2007, the fires in 2020 emitted about 100 Mt-CO2 more which is an increase of over 30%.
In contrast, the 2020 fire activity in Alaska and Canada was well below the fire climatology. The combined fire emissions of CO2 from these two regions were about 6 Mt. The highest ranking year of fire emissions in Alaska was 2004 with 135 Mt-CO2. The highest-ranking year of fire emissions in Canada was 2014 with 115 Mt-CO2.
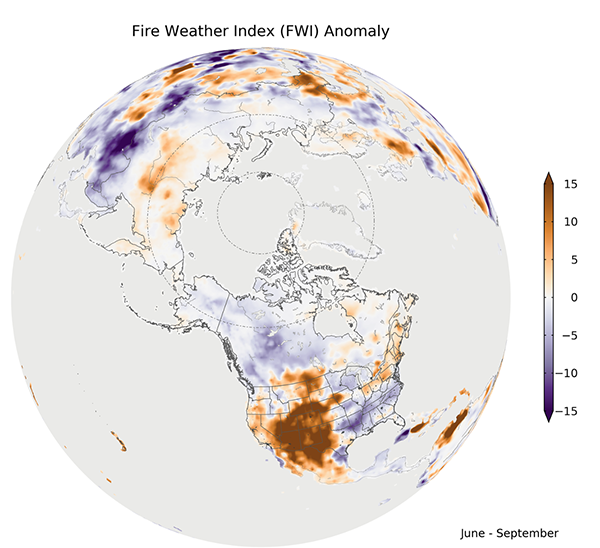
The Fire Weather Index (FWI) based on the commonly used formulation from the Canadian Forest Fire Weather System (Van Wagner, provides convenient numerical measure of fire intensity potential. We used MERRA2 to create FWI anomaly map to gain insight into the role of key meteorological parameters, such as temperature, wind, precipitation and humidity, on the 2020 fires. The positive FWI anomalies in Siberia and Western US are collocated with the locations of the observed fires. The strong relationship between negative departures from the FWI climatology and reduced potential for fires is also evident in Canada and Alaska. Thus, we can partially attribute the behavior of the fires in the major burning regions in the Northern Hemisphere extratropics to the persistent weather patterns during the 2020 fire season, e.g., a historic high latitude heat wave in Siberia.
References:
Darmenov, A. S., A. da Silva, 2015: The Quick Fire Emissions Dataset (QFED): documentation of versions 2.1, 2.2 and 2.4. NASA Technical Report Series on Global Modeling and Data Assimilation 38 (NASA/TM–2015–104606), R.D. Koster (Ed.), p. 212.
Van Wagner, C. E.: Development and Structure of the Canadian Forest Fire Weather Index System, Technical Report 35, Canadian Forestry Service, Ottawa, ON, 1987.