Ocean/Sea Ice: Observing System
The evolution of the ocean observing system, as used in the GEOS
iODAS, is shown in Figure 1. Data assimilated consist of the following:Sea surface temperature (SST)
Temperature (T) and salinity (S) profiles from:
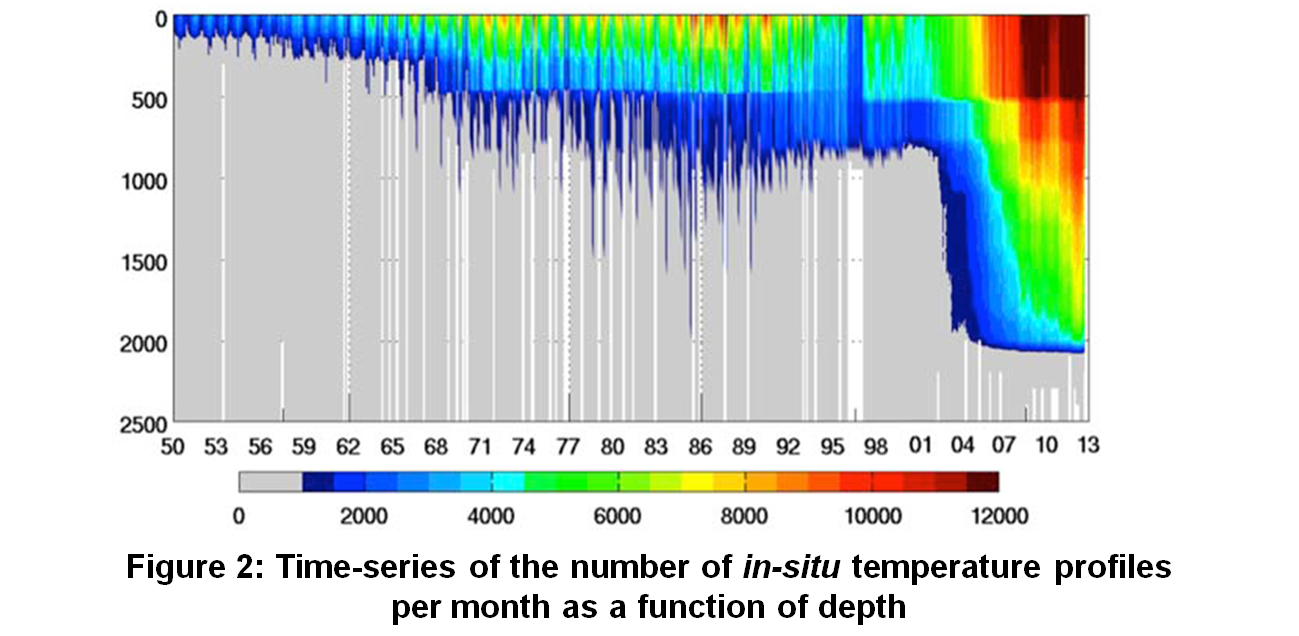
The World Ocean Atlas 2009 (WOA09) gridded climatology (Antonov et al. 2010; Locarnini et al. 2010) is also used to correct some of the model's biases, particularly prior to the Argo era. The ice component of the iODAS assimilates sea-ice concentration from the National Snow and Ice Data Center (NSIDC) from 1979 onwards and the CMIP5 sea ice concentration prior to 1979. The NSIDC product is based on passive microwave observations of ice concentration from the Nimbus-7 Scanning Multi-channel Microwave Radiometer (SMMR) and the Defense Meteorological Satellite Program (DMSP) Special Scanning Microwave Imager (SSM/I) and Special Scanning Microwave Imager/Sounder (SSMI/S). The products have a 25 km spatial resolution for both the north and south polar regions. Temporal resolution is every other day from October 1978 to July 1987 (SMMR), then daily from August 1987 to present (SSM/I). Ice concentrations from CMIP5 and Reynolds are used in areas that are not measured due to orbit inclination (poleward of 87.2° for SSM/I and 84.5° for SMMR). While the near-surface ocean temperature is relatively well observed during the period of interest, that at depth is not. This can be seen in Figure 2, which shows the evolution of the observing system for temperature from 1950 to present. While Figure 2 illustrates a significant increase in profiles to 2000 m from 2003 onwards because of Argo, the horizontal coverage becomes global only from about 2005 onwards. These changes in the observing system can result in large changes in the analysis biases, impacting inferred climate variability. In order to alleviate some of these artifacts, the WOA09 climatology is assimilated to constrain the unobserved ocean towards realistic values. 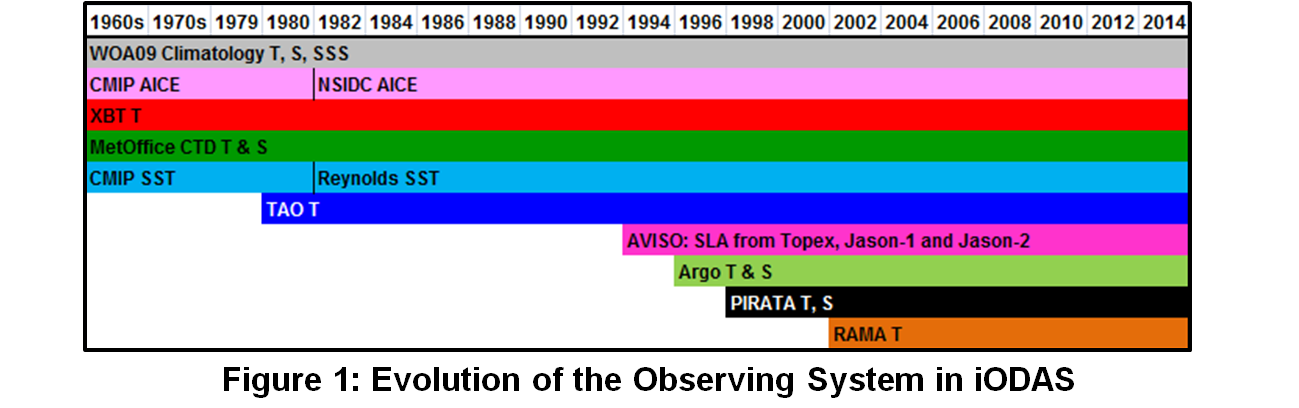
|