
MERRA-2: Improved Representation of Extreme Precipitation Events
Precipitation is both an important societal concern and the most difficult model field to forecast well. Likewise, extreme precipitation events gather significant attention. There is also concern that that the characteristics of extreme precipitation may be changing (for the worse) over climate time scales (NCA, 2013). Reanalyses rely on global models and their parameterizations to provide the quantity and frequency of precipitation, in conjunction with the assimilation of the large scale observation data. Previous work showed that MERRA interannual variability of seasonal extremes was generally weak, across the US (Bosilovich, 2013). Here, we evaluate the MERRA-2 United States summer extreme precipitation climate record, compared to gauge observations and the previous MERRA data.
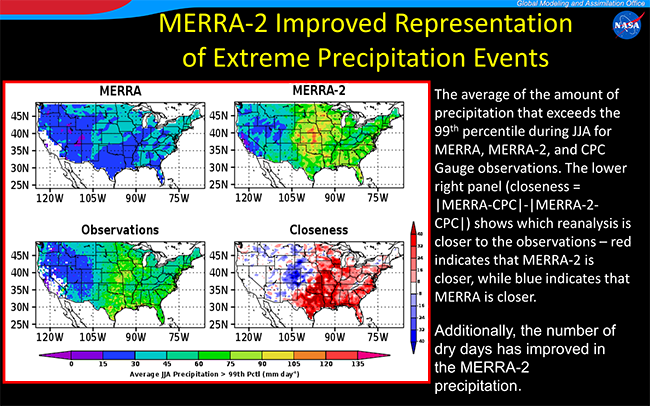
The MERRA 99th percentile precipitation (and the amount that exceeds it) is generally smaller than the observations, but it has many more wet days (days with precipitation > 1mm, not shown). MERRA-2 on the other hand, has generated high values of extreme precipitation, much closer to what the gauge observations show (See figure below). In addition, the patterns of extreme precipitation in MERRA-2 are much more comparable to the observations than MERRA, which has very little or no spatial structure, unlike the observed extreme precipitation. MERRA overestimates the days when extreme precipitation falls, whereas MERRA-2 agrees much better with the gauge data (also MERRA-2 has more realistic number of dry days, when precipitation is less than 1mm).* This can be an indication that the atmospheric dynamics that generate the extreme precipitation are reproduced well in MERRA-2, and so, it will be a useful tool for investigating the weather and climatology of extreme precipitating events.
So, what led to the dramatic improvement of the extreme precipitation? This isn't so easy to answer. During the time that the data assimilation system for MERRA-2 was being developed, numerous changes went into the modeling (updates to the boundary layer and surface layer physics, as well as convective precipitation parameterization), the data assimilation and quality control of the assimilated observations. During that time climate mean precipitation and forecast skills were monitored, but extreme precipitation is not a routine diagnostic, owing to the need for a long climatology of which to base the distribution of precipitation intensity. However changes to the convection parameterization would be a likely candidate (Molod et al. 2015). It is important to note that this comparison relies on the availability of daily observed gauge precipitation data. We can’t assume the same improvement occurs in all land areas
References
Bosilovich, M. G., 2013: Regional Climate and Variability In NASA MERRA and Recent Reanalyses: US Summertime Precipitation and Temperature, J. Appl. Meteor. Climatol., 52, 1939–1951. doi:10.1175/JAMC-D-12-0291.1.
MERRA-2: Initial Evaluation of the Climate (GMAO Tech Memo Vol. 43)
Molod, A., Takacs, L., Suarez, M., and Bacmeister, J., 2015: Development of the GEOS-5 atmospheric general circulation model: evolution from MERRA to MERRA2, Geosci. Model Dev., 8, 1339-1356, doi:10.5194/gmd-8-1339-2015.
NCA 2013: The Third Climate Assessment Report. (Link)
* Keep in mind that this evaluation was done with the model-generated precipitation as opposed to the observation-corrected precipitation used to force the land surface processes.