

A New Generation of GMAO Apps in Google Earth Engine
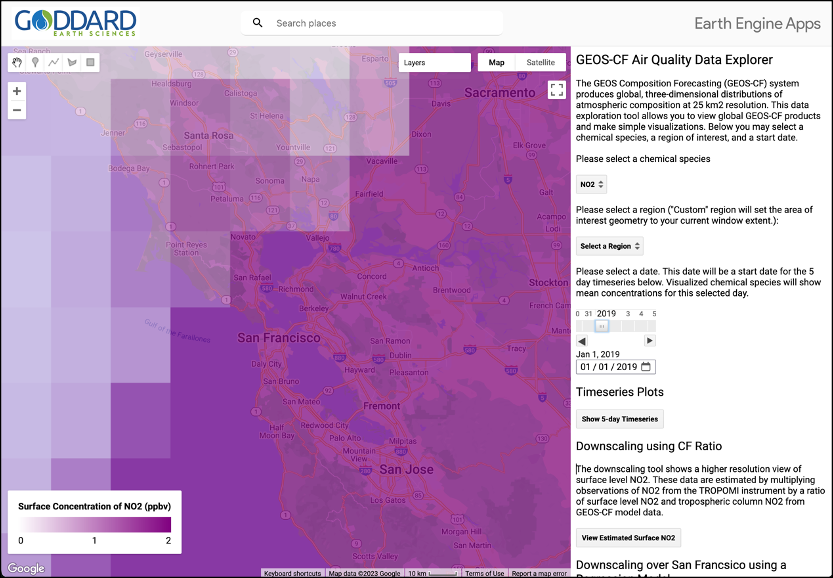
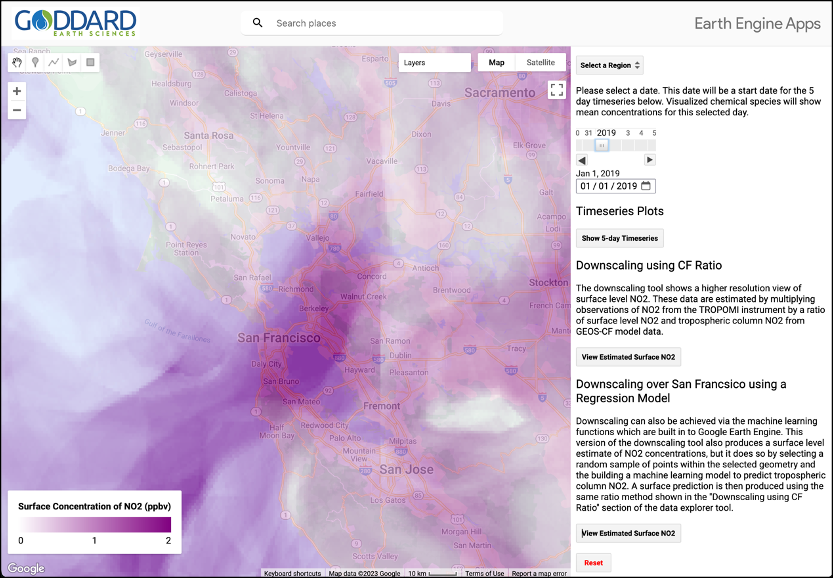
Since the autumn of 2022, high frequency GEOS Composition Forecast (GEOS-CF) data has been ingested into the Google Earth Engine data repository. Using ratio techniques and a machine learning regression algorithm within the Google Earth Engine code editor, an example application, called the GEOS-CF Data Explorer, has been developed to fuse GEOS-CF surface level NO2 data with TROPOMI column NO2 observations. The open accessible tool can be used to visualize mean daily surface-level NO2 as seen in the first image (below). The tool can also generate high-resolution (1km2) surface NO2 maps on demand and in near real-time, as seen in the second image.
NASA’s GEOS composition forecast (GEOS-CF; Keller et al., 2021; https://gmao.gsfc.nasa.gov/weather_prediction/GEOS-CF/) provides daily historical estimates and 5-day forecasts of a suite of atmospheric chemistry and meteorology parameters. Air quality constituents of interest include nitrogen dioxide (NO2), ozone (O3) and fine particulate matter (PM2.5). These constituents originate from a variety of man-made and natural sources and chemical reactions and contribute to poor air quality especially in urban environments or regions impacted by wildfire smoke (https://gmao.gsfc.nasa.gov/research/science_snapshots/2023/health-impacts-over-north-america.php). The GEOS-CF model provides a global gridded dataset with 25 km2 spatial resolution from the surface up to the lower mesosphere (80 km altitude) and offers data at either 15-minute or hourly intervals. The data is currently primarily available in NetCDF format via HTTPS download or OpenDAP streaming.
Google Earth Engine (GEE) offers a rich data repository that allows users to access a wide variety of geospatial datasets and quickly display them on a global map. Users can also plot time-series data, perform mathematical operations between images, and create simple models. Thanks to the broadening of the Google NASA partnership, a selection of GEOS-CF fields (and MERRA-2 reanalysis aerosol parameters) have been ingested into the GEE data repository and can be accessed and used in these various ways (https://www.nasa.gov/feature/nasa-and-google-team-up-to-better-track-local-air-pollution). The data is now ingested daily, maintaining a continuous record of GEOS-CF historical estimates and forecasts. Making GEOS-CF output available on GEE offers a new way to explore these model outputs, both through the Javascript-based GEE code editor and the Python GEE API. In this year in which NASA has declared open science to be a top priority, this new method of retrieving GEOS-CF output from GEE could vastly increase the public exposure to GMAO model and data assimilation products (https://www.earthdata.nasa.gov/news/year-of-open-science).
One of the advantages of GEE is the simplicity with which users can combine disparate datasets, which we illustrate here by combining GEOS-CF fields with NO2 column satellite observations from TROPOMI. As a demonstration of the capabilities of GEE and the value of accessibility of GEOS-CF data, the GEOS-CF Air Quality Data Explorer application (https://callumwayman.users.earthengine.app/view/geoscfexplorer) was created using GEE and the Earth Engine Apps functionality. Earth Engine Apps allows GEE developers to easily publish dynamic user interfaces directly from their personal GEE code editors. The GEOS-CF Air Quality Data Explorer app allows users to display global daily means of NO2, O3, and PM2.5, to view a 5-day time series of the data starting on the selected day, and to generate downscaled estimates of NO2.
Downscaling GEOS-CF data from 25 km2 to TROPOMI scales of 3.5 x 7 km2 provides a more granular view of NO2. This resource could be especially useful at city-scales, allowing people living near higher concentrations of man-made NO2 to be more informed about local air quality and sources of pollutants (https://docs.sentinel-hub.com/api/latest/data/sentinel-5p-l2/). This idea was the motivation behind the downscaling functions built into the GEOS-CF Air Quality Data Explorer application. The first downscaling function creates a downscaled image of surface level NO2 via a simple ratio technique:
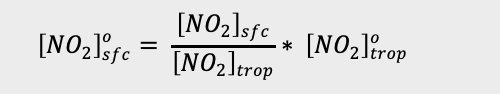
The superscript o designates an observed value from TROPOMI, otherwise the value is modeled by GEOS-CF. The sfc and trop subscripts denote either surface or tropospheric column values, following Cooper et al (2022). This methodology generates a global downscaled estimate of surface level NO2.
The second function in the Data Explorer Application is a small-scale machine learning model which uses a random forest algorithm to downscale GEOS-CF by incorporating a variety of meteorological parameters (relative humidity, surface temperate, wind speed, planetary boundary layer height, etc.) and attempting to generate a prediction of what TROPOMI NO2 observations should look like at that overpass time. This estimate is then multiplied by the aforementioned GEOS-CF ratio to provide an estimate of surface level NO2.
There are two primary motivations for this methodology which are 1) to use machine learning to gap-fill TROPOMI data that may have some areas masked by cloud-cover, and 2) to train a spatial model to produce estimates of surface level NO2 at points in the time series where there is GEOS-CF data, but not TROPOMI data.
The image produced by the machine learning method is presented at a significantly smaller resolution than the expected 3.5 x 7 km2 tiles seen in TROPOMI data. The final resolution of the downscaled image is 0.01 arc degrees or approximately 1.11 km2. This is a result of how GEE stores TROPOMI data, which is at a pixel resolution of 0.01 arc degrees.
The goal of the GEE GEOS-CF Air Quality Data Explorer is to provide an open-source example for effectively combining GMAO model output with ancillary data sources such as satellite observations. The application can easily be modified or extended to fit end-users needs. As such, the GEOS-CF Air Quality Data Explorer provides a proof of concept for interacting with GEOS-CF data in GEE. The application shows only a small subset of possibilities available to users accessing the data in the GEE data repository and could provide a steppingstone for more advanced tools and analyses.