

A Dusty Atmospheric River Brings Floods to the Middle East
The frequency and intensity of weather-related extreme events, particularly floods, have increased in recent decades, both globally and in parts of the Middle East. Some floods are caused by heavy rains from atmospheric rivers (AR), which are long, narrow, and transient corridors of strong horizontal water vapor transport. While the impacts of ARs on coastal regions of North America and Europe have been extensively studied, much less is known about their characteristics and contribution to flooding in the Middle East. Here, we showed that an ~5,500 km long AR was responsible for torrential rainfall and rapid snowmelt in northwestern Iran that caused deadly floods in April 2017. Despite its adverse societal consequences, this event was beneficial to the recovery of the desiccating Lake Urmia (Nature 2021). This AR highlights the concept of "dusty atmospheric river," which is attributed to major mineral dust sources in the region. This event was reasonably predicted at 7-day lead time, crucially important for improving early warning systems and mitigating the adverse impacts of ARs (Dezfuli 2022).
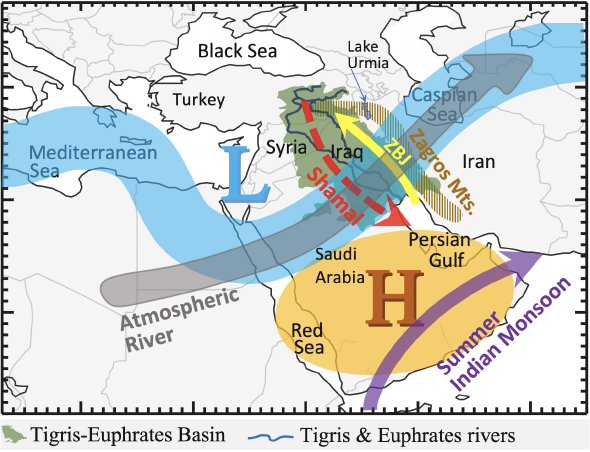
Precipitation is a key element affecting various types of extreme events, so it is crucial to know why, where, when, and how much it rains in the region. The answers require a full understanding of the complex interaction between several climate features, including ARs, which act across spatial and temporal scales (Figure 1). This study, as a follow-up to another related paper (Dezfuli 2020), has tried to shed light on the mechanisms, impacts, and predictability of the ARs in the Middle East and layout their implications for short to long-term water resources planning. Various NASA products have been used for diagnostics and predictions: IMERG V06 for precipitation; MERRA-2 for meteorological variables, dust column mass density, and vertically integrated water vapor transport (IVT); VIIRS Corrected Reflectance imagery to detect thick ice and snow; and weather forecasts from GEOS model.
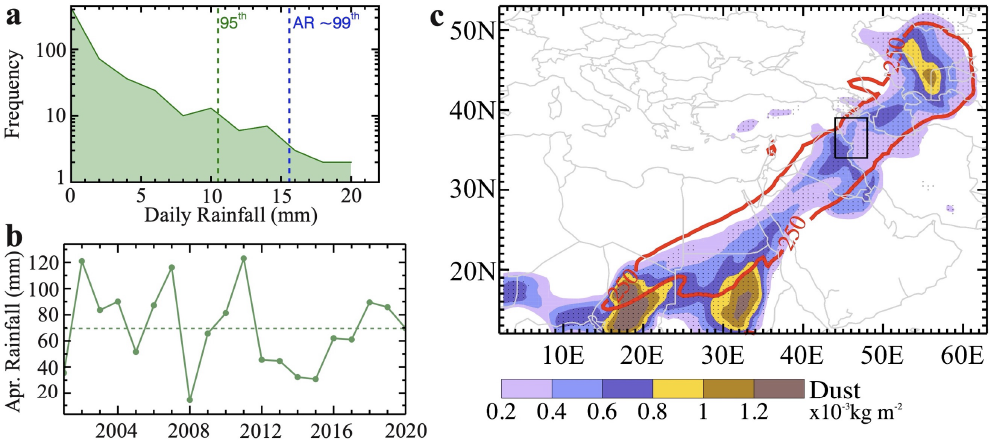
Torrential rainfall on April 14, 2017, caused heavy flooding and landslides over northwestern Iran. The areal average rainfall was approximately equivalent to the 99th percentile of the April daily rainfall over the 2001-2020 period (Figure 2a). However, monthly precipitation in April 2017 was moderately below average (Figure 2b), underlining the fact that heavy floods can happen in both dry and wet years, as observed in the 2019 case study (Dezfuli 2020). Analysis of IVT, using a 250 kg m-1 s-1 threshold, revealed that an atmospheric river was responsible for the heavy rains (Figure 2c). Maximum precipitation occurred over the Lake Urmia Basin and extended to parts of Turkey and Iraq, consistent with orographic forcing associated with the AR passing over the Zagros Mountains. The strong horizontal winds in the lower troposphere associated with this AR transported significant amount of dust while propagating through some of the world’s major sources of mineral dust located in deserts of the Middle East and North Africa (MENA, Figure 2c). The overall synoptic-scale weather patterns of this AR were quite typical with a low-level jet ahead of the associated cold front. This configuration facilitated moisture flux towards the AR corridor, primarily from the Mediterranean and Red Seas.
The heavy rains reinforced by rapid snowmelt from the highlands located to the east of Lake Urmia caused the floods. Satellite images taken before and after the event show a reduction of nearly half the snow surface (Figure 3a,b). This reduction may be attributed to both rainfall and warm advection associated with the AR. As the AR approached the region the 2-meter air temperature increased by ~8 °K in hours preceding the rainfall event (Figure 3c).
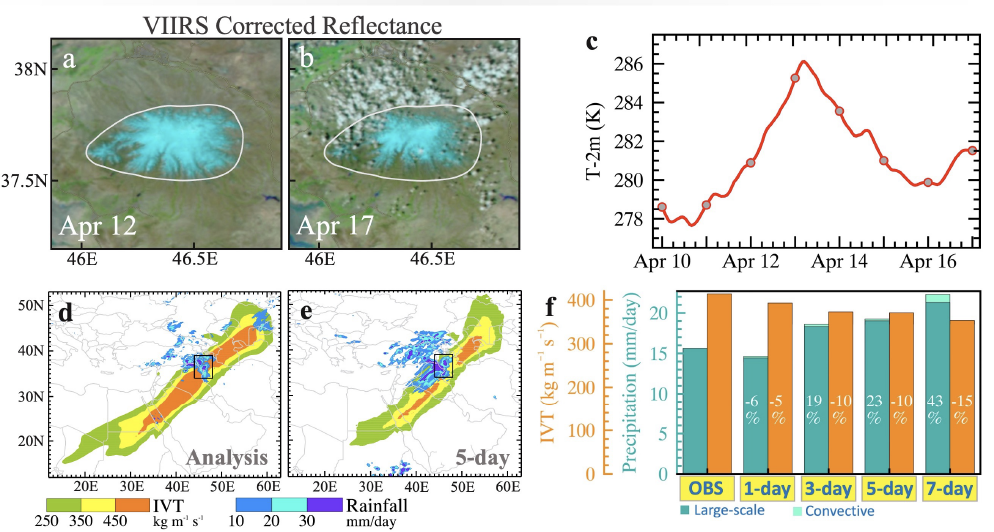
We evaluated the skills of deterministic forecasts provided by NASA’s GEOS model at different lead times (1 to 7 days). As an example, a qualitative assessment of the IVT patterns at 5-day lead time showed that the AR structure was reasonably captured when compared with the analysis from the same GEOS model version (Figure 3d,e). In order to quantify the prediction skills, we have evaluated the regional mean precipitation and IVT (Figure 3f). The 1-day lead forecast of precipitation is nearly the same as the satellite-based observations. The forecasts at 3 and 5-day leads show an approximately 20% overestimation, which is within an acceptable range given the uncertainties from IMERG observations. The overestimation grows with lead time and reaches 43% at 7-day lead. However, the IVT forecast decreases at longer lead-times, although the range of its percent difference is much narrower than that of precipitation.
More details about this study can be found in Dezfuli et al. (2021). The atmospheric river phenomenon is an emerging area of research for MENA. Several future research directions along with their implications for short to long-term planning have been laid out in Dezfuli (2022).
References:
1. Dezfuli, A., 2020. Rare atmospheric river caused record floods across the Middle East. Bulletin of the American Meteorological Society, 101(4), E394-E400. doi: 10.1175/BAMS-D-19-0247.1
2. Dezfuli, A., Bosilovich, M.G. and Barahona, D., 2021. A Dusty Atmospheric River Brings Floods to the Middle East. Geophysical Research Letters, 48(23), e2021GL095441. doi: 10.1029/2021GL095441
3. Dezfuli, A., 2022. Studying the Middle East's sky rivers. Nature Middle East. doi:10.1038/nmiddleeast.2022.8
4. Nature, 2021. ‘Sky river’ brought Iran deadly floods — but also welcome water. Nature, 600(363). doi: https://doi.org/10.1038/d41586-021-03646-5