

2021 Greenland Ice Sheet Melt Events: A Variety Pack
Introduction
On the Greenland Ice Sheet, surface melt commonly occurs at low elevations, along the ice margins. Over the last two decades, the summer melt season has become longer and is more frequently punctuated by episodic surface melt events that cover large areas of the ice sheet. Understanding the atmospheric conditions driving these events and their subsequent impact on ice sheet conditions is important to understanding Greenland’s role in rising global sea levels.
The runoff of surface meltwater contributes directly to sea level change; the introduction of meltwater down into the underlying ice sheet may also influence the rate at which glacial ice flows to the ice sheet edge; and changes on the surface due to melting can make the ice sheet more vulnerable to successive melting. Melting of the wintertime snow and bare ice areas may also precondition the ice sheet to subsequent melt events by darkening the surface. And as a practical matter, extensive melt events create unsafe working conditions for field researchers on the ice sheet by creating areas of flowing and draining meltwater and can be hazardous to downstream Greenland communities.
Atmospheric Circulation and the 2021 Melting Events
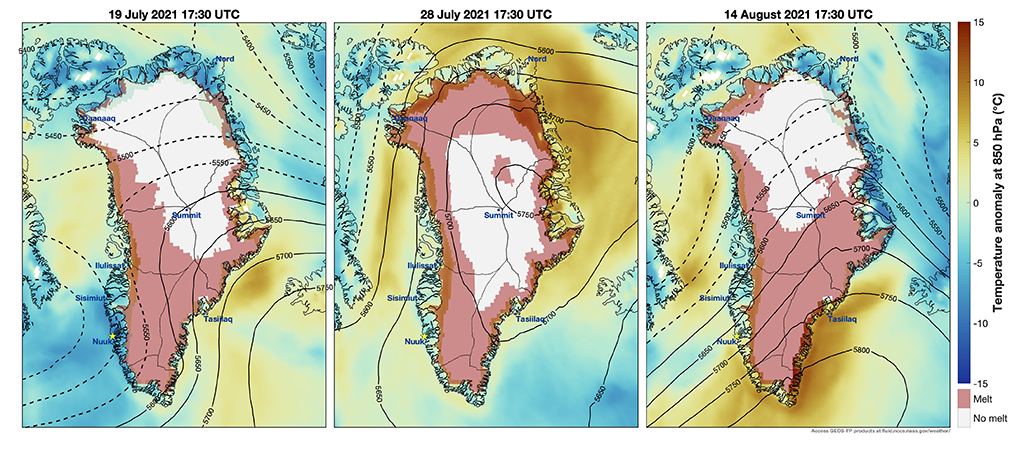
The summer of 2021 is remarkable for a series of late-summer melt events that have covered large areas of the Greenland Ice Sheet, even extending to its highest point at Summit Station. These events have been captured in the GMAO Forward Processing (FP) analyses, and in routine numerical weather predictions produced from the GEOS forecast model. Shown in Animations 1-3 is the evolution of three Greenland melt events that occurred on 19-July, 28-July, and 14-August. At their peaks, these events produced simultaneous melt over 49, 63, and 59 percent of the total ice sheet area, respectively – an area ranging from 840,000 to 1.1 million square kilometers.
Melt events such as these occur through variations in the large-scale atmospheric circulation – specifically through an intensification of the prevailing anticyclonic circulation over the ice sheet. The typical mechanism is a blocking high pressure ridge that forms over the mid-latitudes of the North Atlantic Ocean. These are slow-moving features that block the zonal flow, are characterized by a capital omega-shape in the pressure field and are associated with midlatitude heatwaves. (See https://gmao.gsfc.nasa.gov/research/science_snapshots/2021/nw_heatwave_june2021.php.)
The mechanisms for producing surface melt can vary between melt events and even within the same melt event. High pressure is generally associated with clearing skies, which permits enhanced solar radiation to drive melting. However, the ridging pattern may also transport a layer of warm, moist air from the south on to the ice sheet, which can produce melt either from direct interaction with the surface, or through increased cloud cover and emission of thermal radiation.
GEOS Model Visualizations
The included animations show that the surface melt patterns are related to the orientation of the blocking ridge. In the first event on 19-July, the ridge is located to the southeast and is impeded by topography from transporting southerly air to higher latitudes (Animation 1). The areas of melt are mainly restricted to the southern half of the ice sheet. In the other two events, the ridge is oriented to allow for the advection of warm air northward along the western edge of Greenland.
For the melt event on 28-July, the ridge extends far north over the Summit plateau and allows for warm air advection to wrap eastward over the Arctic Ocean coast, which is coincident with extensive melt over northern areas of the ice sheet (Animation 2). In contrast to the other events, there is an absence of cloud cover over the ice sheet on 28-July. For the event on 14-August, the omega blocking pattern does not extend as far north, and melt is mostly confined to the southern two-thirds of the ice sheet (Animation 3).
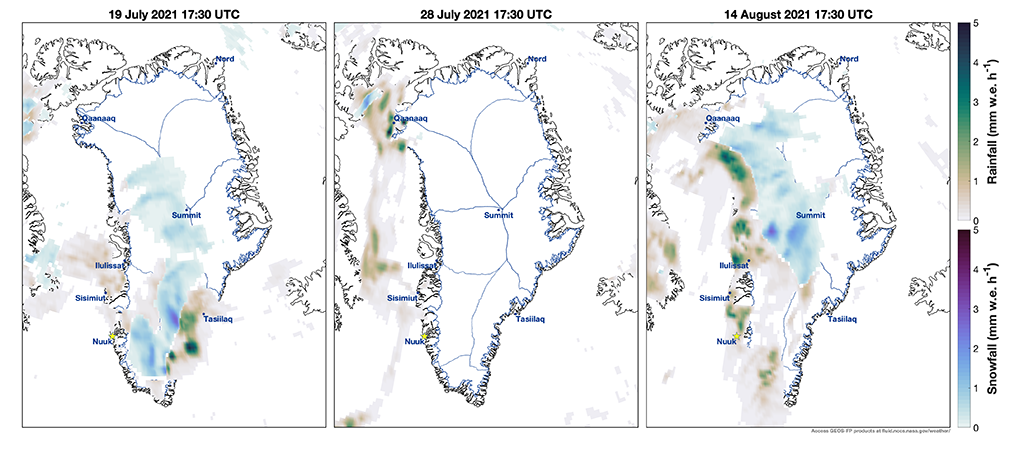
A notable feature of the 14-August event is presence of widespread rainfall on the high interior plateau (Animation 3), and there is a considerable rain shield extending over the western side of the ice sheet. Rain is not uncommon on the ice sheet, but almost exclusively occurs at the lower elevations of the ice sheet periphery. Rainfall extending to Summit Station is a very rare occurrence; rainfall further enhances surface melt through the introduction of liquid water onto the snowpack.
Analysis of the GEOS forecast system indicates that the 2021 melt events were predicted many days in advance. For the event on 14-August, large-scale surface melt was forecast with a lead time of as much as 8 days, and with the magnitude becoming locked in with a forecast lead-time of about 4 days. Historically, atmospheric blocking is challenging for numerical weather prediction due to the rapid evolution of synoptic-scale processes at the onset. The effective GEOS forecasts are likely to result from the high spatial resolution of synoptic systems and the adequate treatment of surface processes on the ice sheet.
The three 2021 events are varied in the large-scale circulation, in the role of clouds, and in the role of precipitation (Figures 1 & 2). In turn, they are all dissimilar from the late July 2019 melt event that was characterized by a retrograde advection of warm air from western Europe (https://gmao.gsfc.nasa.gov/research/science_snapshots/2019/Greenland_ice_melt.php). Characterizing the range of atmospheric conditions that can trigger widespread melting is critical to understanding how Greenland Ice Sheet surface mass balance will evolve in response to a warming climate, now and in the future.
Figures:
Animations:
Animation 1:
Animation 2:
Animation 3: