
SUMMER 2017: SIGNALS OF WEATHER EXTREMA SHOWN IN THE AEROSOL FIELDS
Over the North Atlantic and North America, the northern summer of 2017 was characterized by a series of extreme weather events. This includes a number of major hurricanes in the Gulf of Mexico and the Atlantic Basin, along with severe dry conditions in the North West that provided the conditions for major fire (biomass burning) events. The GEOS Earth System modeling and analysis system is used to bring together numerous disparate observations, providing a unique view of the weather systems through their visual impacts on the aerosol fields.
Goddard Earth Observing System (GEOS) models, combined with data from NASA's Earth observing satellites, enhance our scientific understanding of specific chemical, physical, and biological processes.
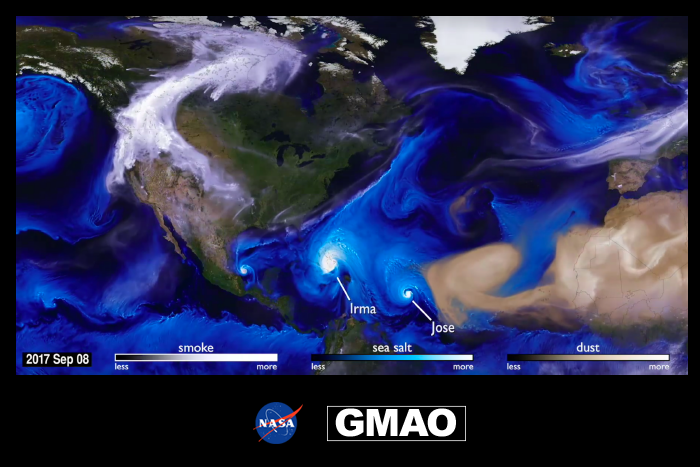
In this still image from September 8, 2017, hurricanes and tropical storms are obvious from the large amounts of sea salt particles caught up in their swirling winds. The dust blowing off the Sahara, however, gets caught by water droplets and is rained out of the storm system. Smoke from the massive fires in the Pacific Northwest region of North America are blown across the Atlantic to the UK and Europe.
The full visualization at svs.gsfc.nasa.gov/12772 is a result of combining NASA satellite data with sophisticated mathematical models that describe the underlying physical processes.
» Click for PDF «
The image shows three types of aerosols that are carried in the GEOS system. Dust, shown in brown tones, is emitted over dry land surfaces according to the strength of the flow. Sea salt, shown in blue tones, is similarly lofted from the ocean according to the wind speed and the roughness of the ocean surface. Each of those sources to the atmosphere is computed using the local flow in the GEOS model. Smoke emissions are computed using the “QFED” fire module (Darmenov and da Silva, 2015) that include observations of fire-radiative power observed by NASA’s MODIS instruments. The flow in the GEOS model is heavily constrained by the entire suite of real-time observations used in the GEOS-FP system, which includes data from NASA’s AIRS and other instruments. This image, as well as the animation that it accompanies, was generated by replaying the GEOS model to the GEOS-FP analyses, so that the meteorological fields remain true to observations and integrated forwards with a spatial resolution of c1440 on the cubed-sphere grid, corresponding to grid boxes with side lengths of around 6km.
The image, for 00Z on September 8, 2017, clearly shows the signatures of hurricanes Irma and Jose in the tropical Atlantic Ocean. High densities of sea-salt aerosols coincide with the locations of the cores of these two hurricanes, with clear circulation patterns showing the rain bands swirling out from the cores. Behind these hurricanes, an easterly wave is carrying large amounts of dust from the Sahara out over the Atlantic Ocean. In the Gulf of Mexico, Hurricane Katia is evident against the Mexican coastline. The arid conditions in the Pacific Northwest led to extreme biomass-burning events in that region, highlighted by the smoke aerosols. Emitted by the fires, these aerosols are lofted locally and can be captured in weather systems; once they are lofted away from the surface, these aerosols can be transported over very long distances. In this image, these smoke aerosols are seen extending over the North-East Pacific Ocean, down the Eastern side of the Rocky Mountains into the central US, and extending North-Eastward up to northern Canada and the Arctic; a trail of these aerosols has also just been transported over the Atlantic Ocean and remains visible from the middle Atlantic over Northern Spain and a large area of Europe.
The dynamic nature of these aerosols and their time evolution are highlighted in the accompanying animation, released by NASA’s Science Visualization Studio. This animation “Tracking Aerosols Over Land and Water With GEOS” captures the time dependence of these aerosols over the summer, from July 31 through November 1, 2017. During the 2017 hurricane season, the storms are visible because of the sea salt that is captured by the storms. Strong winds at the surface lift the sea salt into the atmosphere and the particles are incorporated into the storm. Hurricane Irma is the first big storm that spawns off the coast of Africa. As the storm spins up, the Saharan dust is absorbed in cloud droplets and washed out of the storm as rain. This process happens with most of the storms, except for Hurricane Ophelia. Forming more northward than most storms, Ophelia traveled to the east picking up dust from the Sahara and smoke from large fires in Portugal. Retaining its tropical storm state farther northward than any system in the Atlantic, Ophelia carried the smoke and dust into Ireland and the UK.
The animation is available at:
http://svs.gsfc.nasa.gov/12772
and on social media:
https://www.youtube.com/watch?v=h1eRp0EGOmE
https://www.facebook.com/NASAGoddard/videos/10156781089935898/
https://twitter.com/NASAGoddard/status/930102087563739136
Reference
Darmenov, Anton, and Arlindo da Silva, 2015. The Quick Fire Emissions Dataset (QFED): Documentation of versions 2.1, 2.2 and 2.4. NASA/TM–2015–104606, Vol. 38.