
Forecasting the Mt. Agung Ash Cloud Using GEOS
The potential eruption of Mt. Agung in Bali, Indonesia has led to concern about both the potential impacts of sulfate aerosols on the global atmospheric circulation over the coming seasons and on the effects of volcanic ash on commercial air transportation. Several phreatic and magmanic eruptions of Mt. Agung in late November and early December 2017 are known to have led to ash emissions in the lower-to-middle troposphere. These prompted the evacuation of 100,000 people within a 10-km radius of the mountain and led to the suspension of flights at Ngurah Rai International Airport.
GEOS-FP, the near-real-time analysis and forecast system used in the GMAO, includes a variety of aerosols. While the constant outgasing of volcanoes around the globe is routinely incorporated, the GEOS systems are not equipped to dynamically include the eruption of live events like Mt. Agung in real time. In such cases, experimental versions of the GEOS modeling system can be deployed to supplement the GMAO's near-real-time products and produce forecasts of the volcanic impacts from the dispersion of ash, SO2 and sulfates around the globe. For relatively small eruptions such as this one, SO2 emissions fluxes are derived from satellite mass observations, while ash emission fluxes rely on empirical relationships based on plume maximum altitudes. Emission duration and maximum plume altitudes were taken from reports by the Darwin Volcanic Ash Advisory Center (VAAC).
This capability has been used to simulate an ash cloud from the Mt. Agung eruption, beginning with a forecast on November 29, 2017. The experimental model is started from the analyses generated by the GEOS-FP systems, with the addition of the emission source terms summarized in Table 1. Apart from this perturbation, the forecast is identical to the regular forecast produced by GEOS-FP, including the spatial resolution (approximately 12.5-km box edges on the grid). The plot shown is the difference in ash concentrations between the perturbed and regular forecasts, shown at 00Z on December 1, 2017, 48 hours into the forecast.
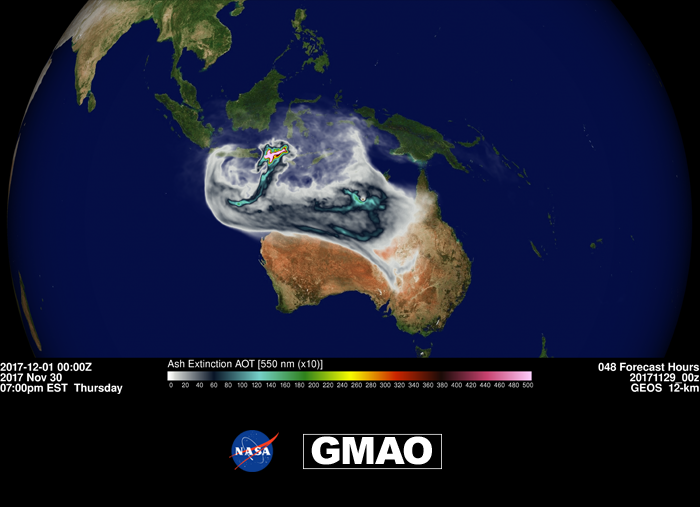
Table 1. Emission source terms assumed in GEOS-FP for Mt. Agung eruption.
|
SO2 Loading [kt] |
SO2 Flux [kg/s] |
Ash Mass Altitude [km] |
Ash Flux [kg/s] |
Start Time [UTC] |
Stop Time [UTC] |
|
| Nov. 26 | N/A | 83.4 | 9 | 2.34e5 | 13:19 | 23:59 |
| Nov. 27 | 10 | 83.4 | 9 | 2.34e5 | 00:00 | 23:59 |
| Nov. 28 | 15 | 86.8 | 7.6 | 2.34e5 | 00:00 | 23:59 |
This capability demonstrates a rapid-response capability with the GEOS model to estimate the impacts of the ash cloud and sulfate aerosols from eruptions such as those of Mt. Agung in late 2017. For larger emissions for which additional observations are available, emission height and profiles can be estimated by means of inverse calculations based on NASA satellite observations. These forecasts demonstrate the dispersion of the volcanic ash (and sulfate) aerosols and their potential impact on the regional and global weather in these 10-day forecasts.
VISUALIZATIONS:
Volcanic Ash
To view this animation in full-size, visit: https://gmao.gsfc.nasa.gov/research/science_snapshots/anim/plot_ashvolc-mtagung_proj_G5GMAO-GEOS_12KM-20334992-e20171125_21z_1080p.mp4
Sulfur Dioxide (SO2)
To view this animation in full-size, visit: https://gmao.gsfc.nasa.gov/research/science_snapshots/anim/plot_so2volc-mtagung_proj_G5GMAO-GEOS_12KM-20334992-e20171125_21z_1080p.mp4
Sulfate (SO4)
To view the full-size animated version, visit: https://gmao.gsfc.nasa.gov/research/science_snapshots/anim/plot_s04volc-mtagung_proj_G5GMAO-GEOS_12KM-20334992-e20171125_21z_1080p.mp4