|
MERRA: MODERN-ERA RETROSPECTIVE ANALYSIS FOR RESEARCH AND APPLICATIONS
|
Begin Main Content
MERRA studies of Hydrological Extremes
|
|
The GEOS5-MERRA reanalysis products will cover the satellite era from 1979 to the present.
A special focus of the atmospheric assimilation will be the hydrological cycle.
At present we use the GEOS4-CERES experiment as a demonstration and placeholder.
The GEOS4-CERES reprocessing was performed to support the CERES instrument team
research efforts. It is not publicly available.
|
Wet versus Dry comparison
In the figures below we focus on the difference
between two seasons in North America:
- summer 1988: Drought
- summer 1993: Rainy
The four compared data sets are
the GMAO assimilation experiment GEOS4-ceres,
the ECMWF 40-year reanalysis
(((The spatial resolutions of these gridded products are tabulated on our page
Basic Climate Analysis.
Click on any image to expand it in a separate window.
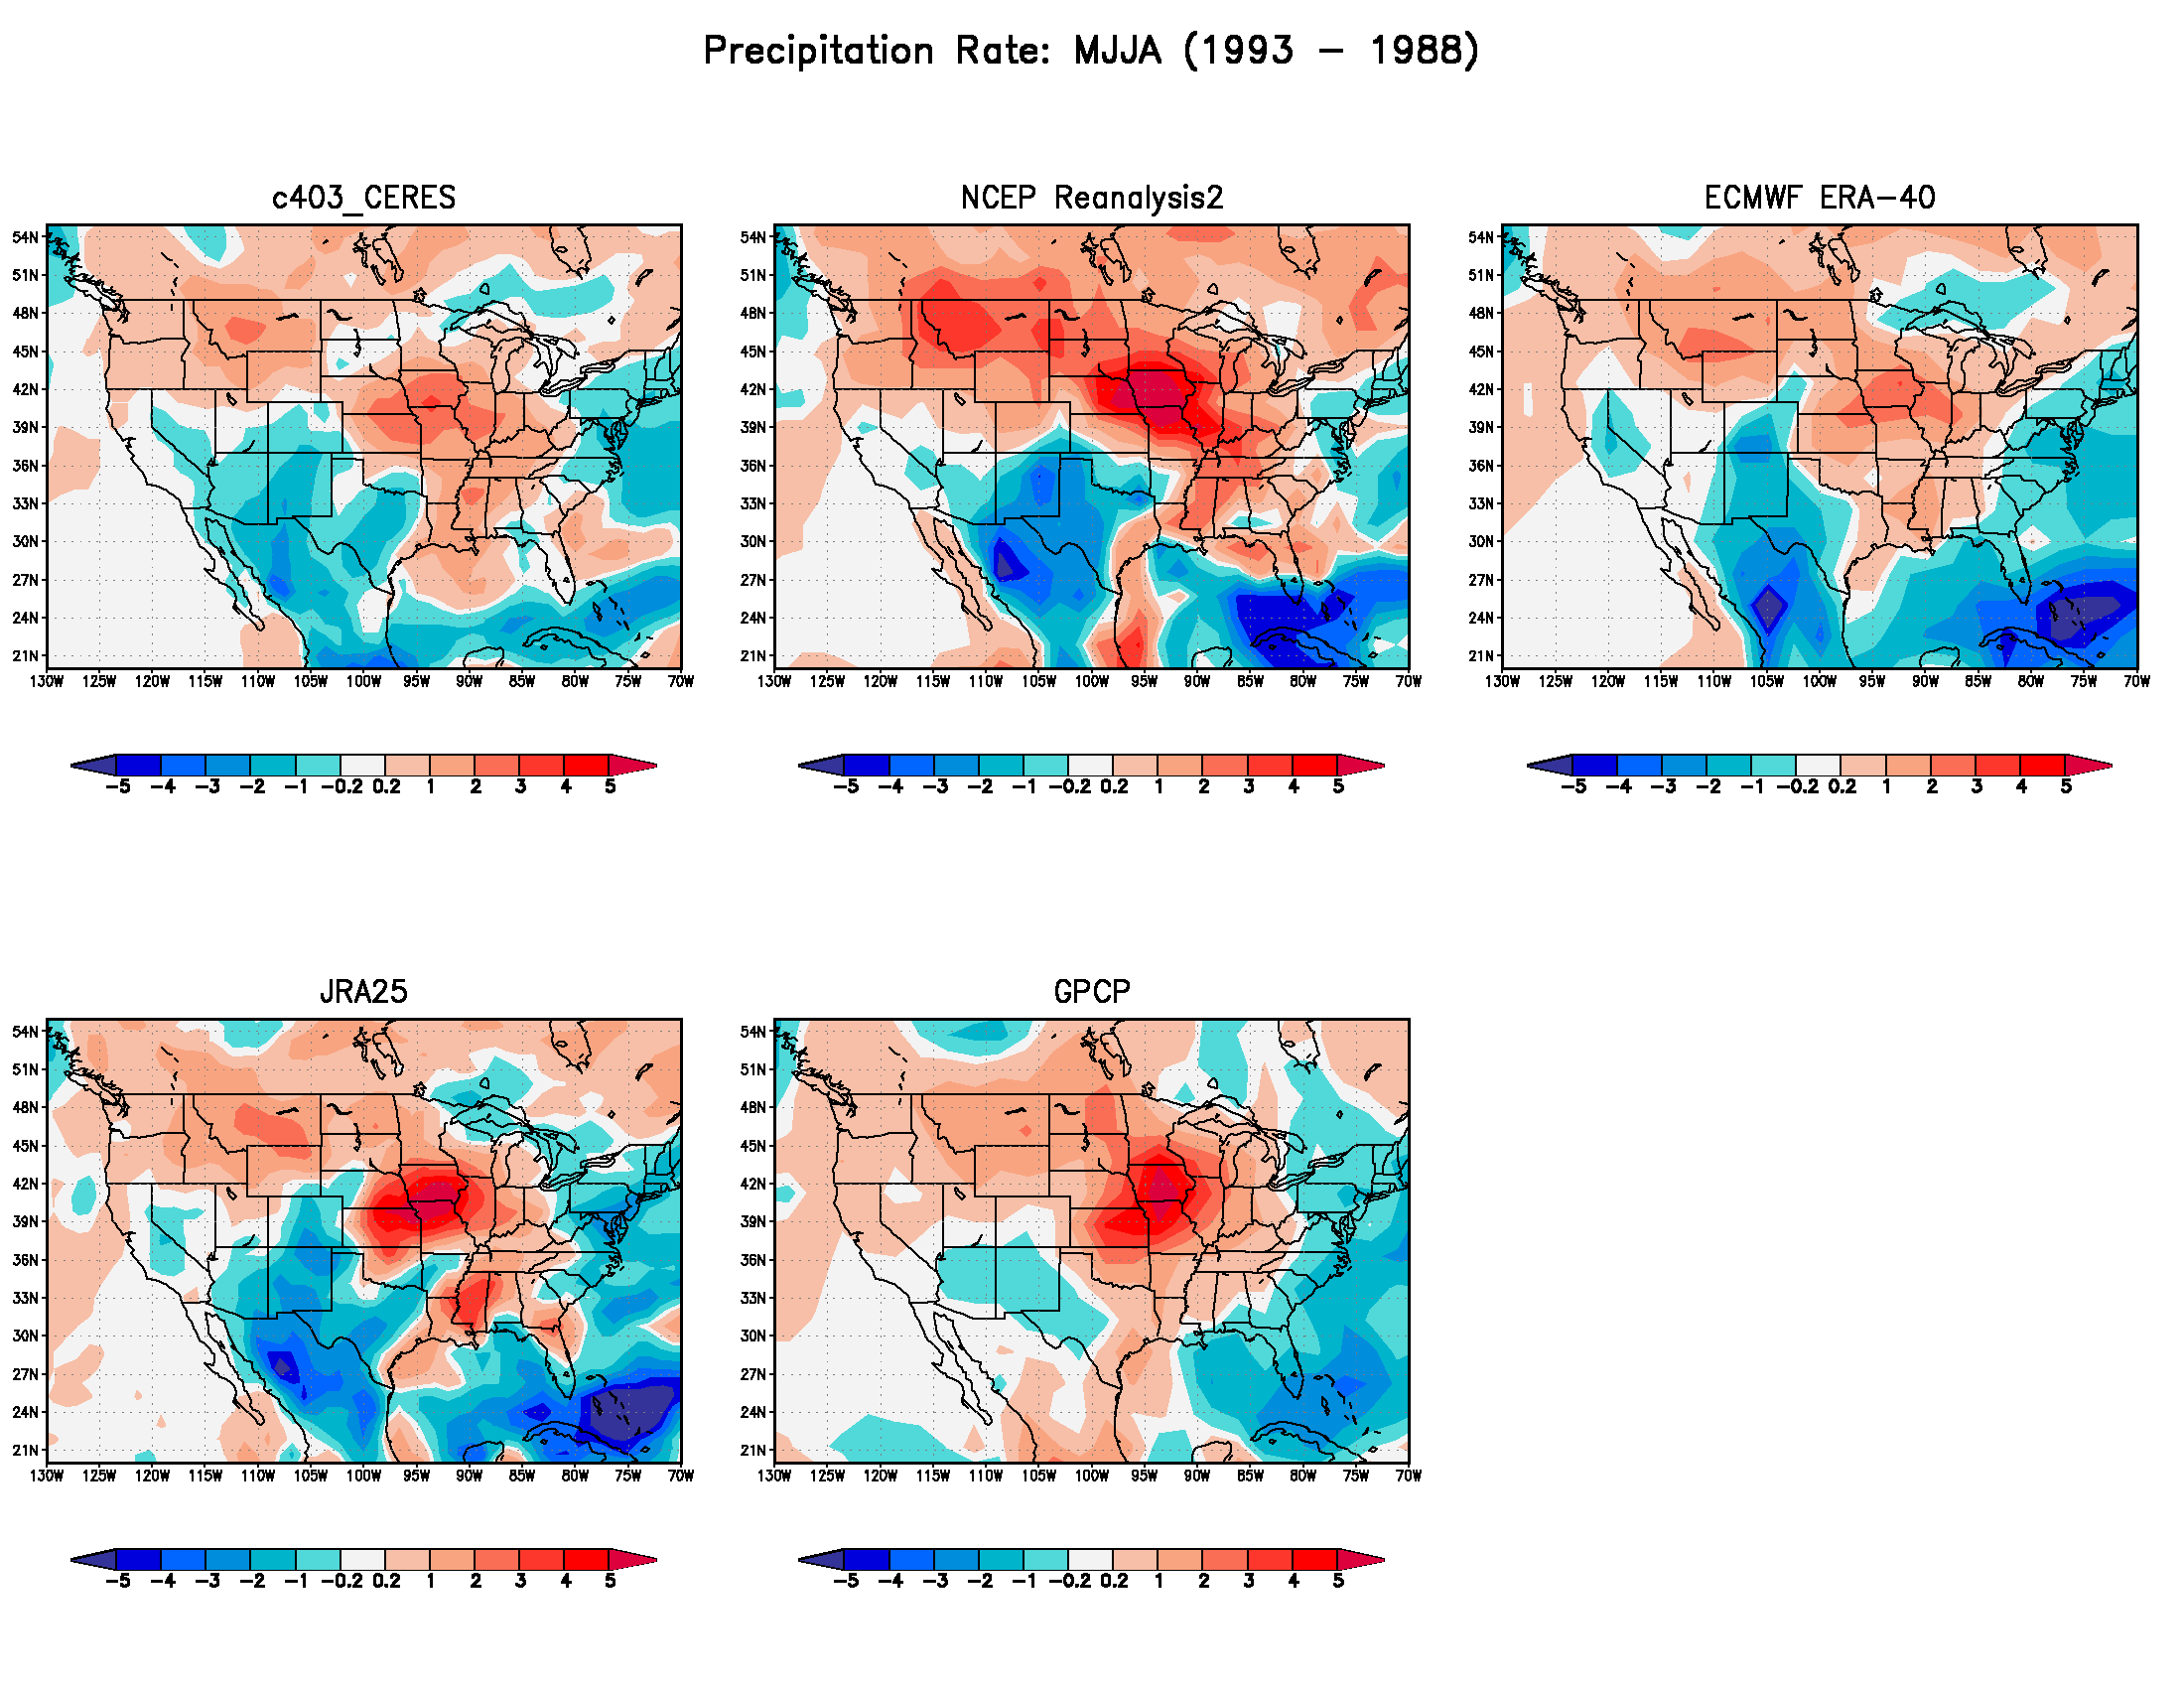
Figure 1. Precip
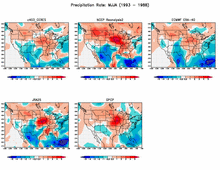
|
The difference in Precipitation (mm/day)
for the wet (1993) minus dry (1988) season are displayed
for the five data sets
GEOS4-CERES (upper left),
NCEP-R2 (upper middle),
ERA-40 (upper right),
JRA-25 (lower left),
GPCP (lower middle).
|
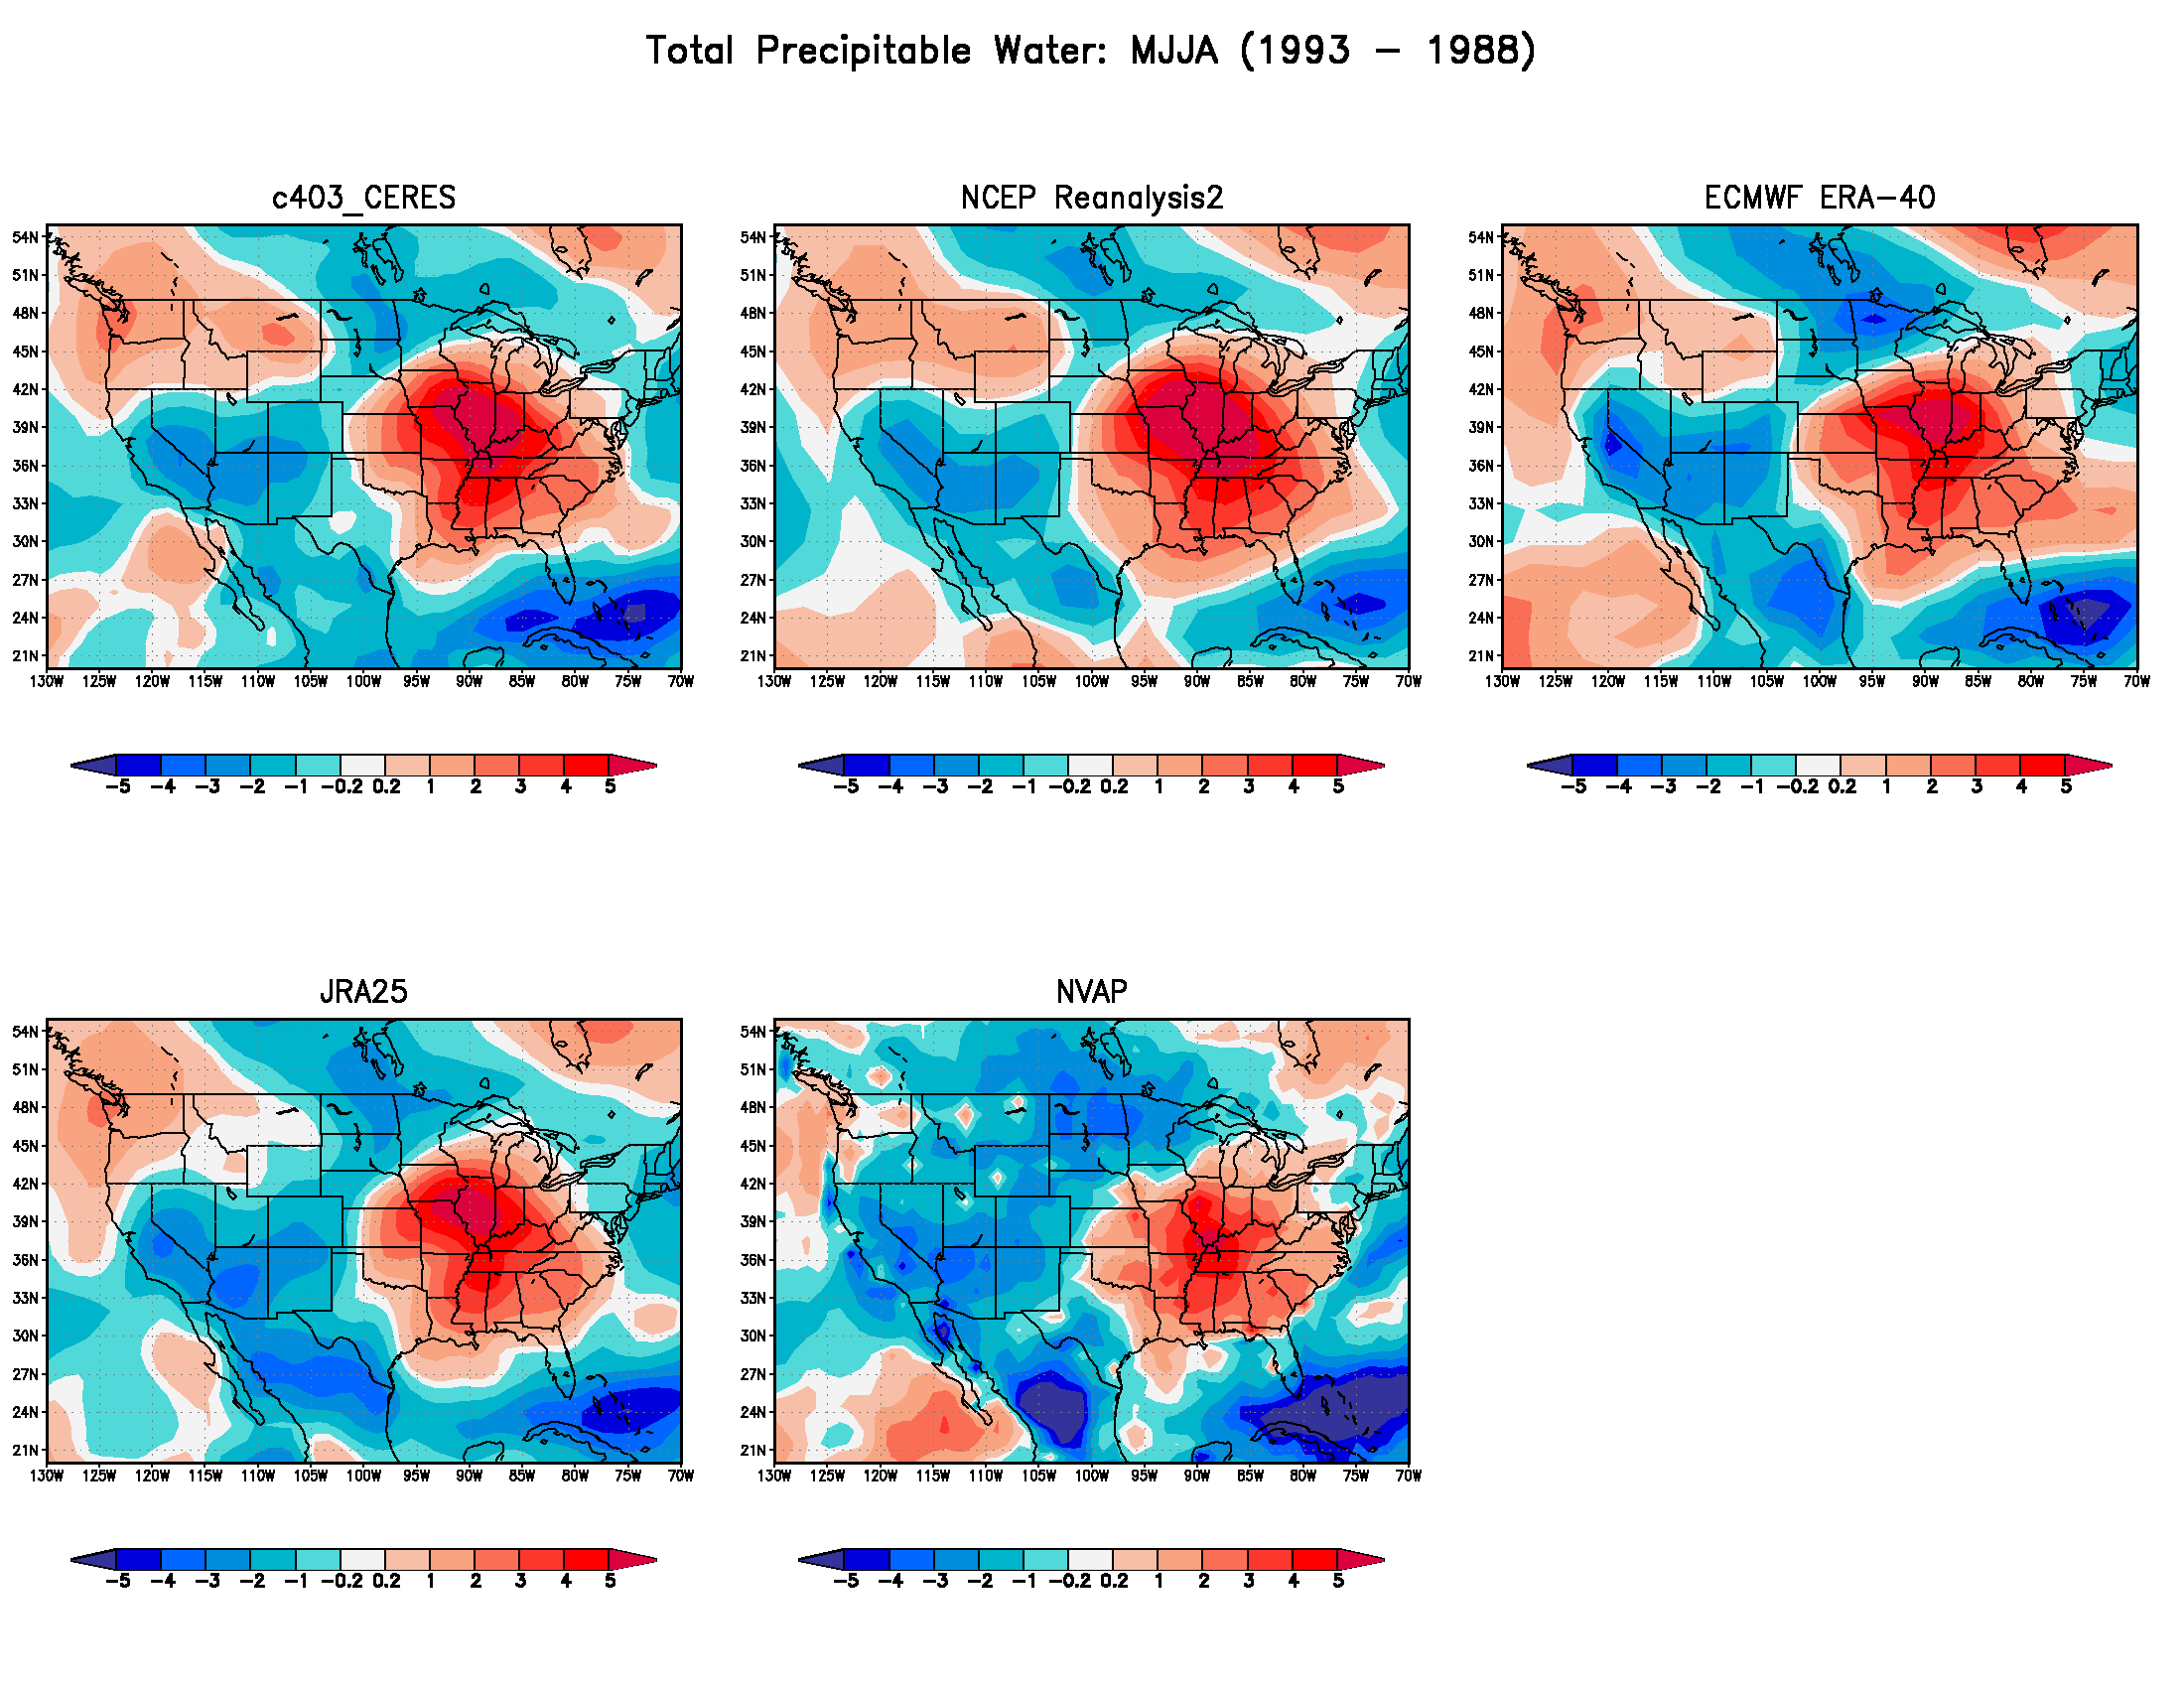
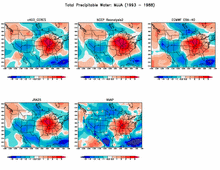
Figure 2. TPW
|
The difference in Total Precipitable Water (TPW; kg/m^2)
for the wet (1993) minus dry (1988) season are displayed
for the five data sets
GEOS4-CERES (upper left),
NCEP-R2 (upper middle),
ERA-40 (upper right),
JRA-25 (lower left),
NVAP (lower middle).
|
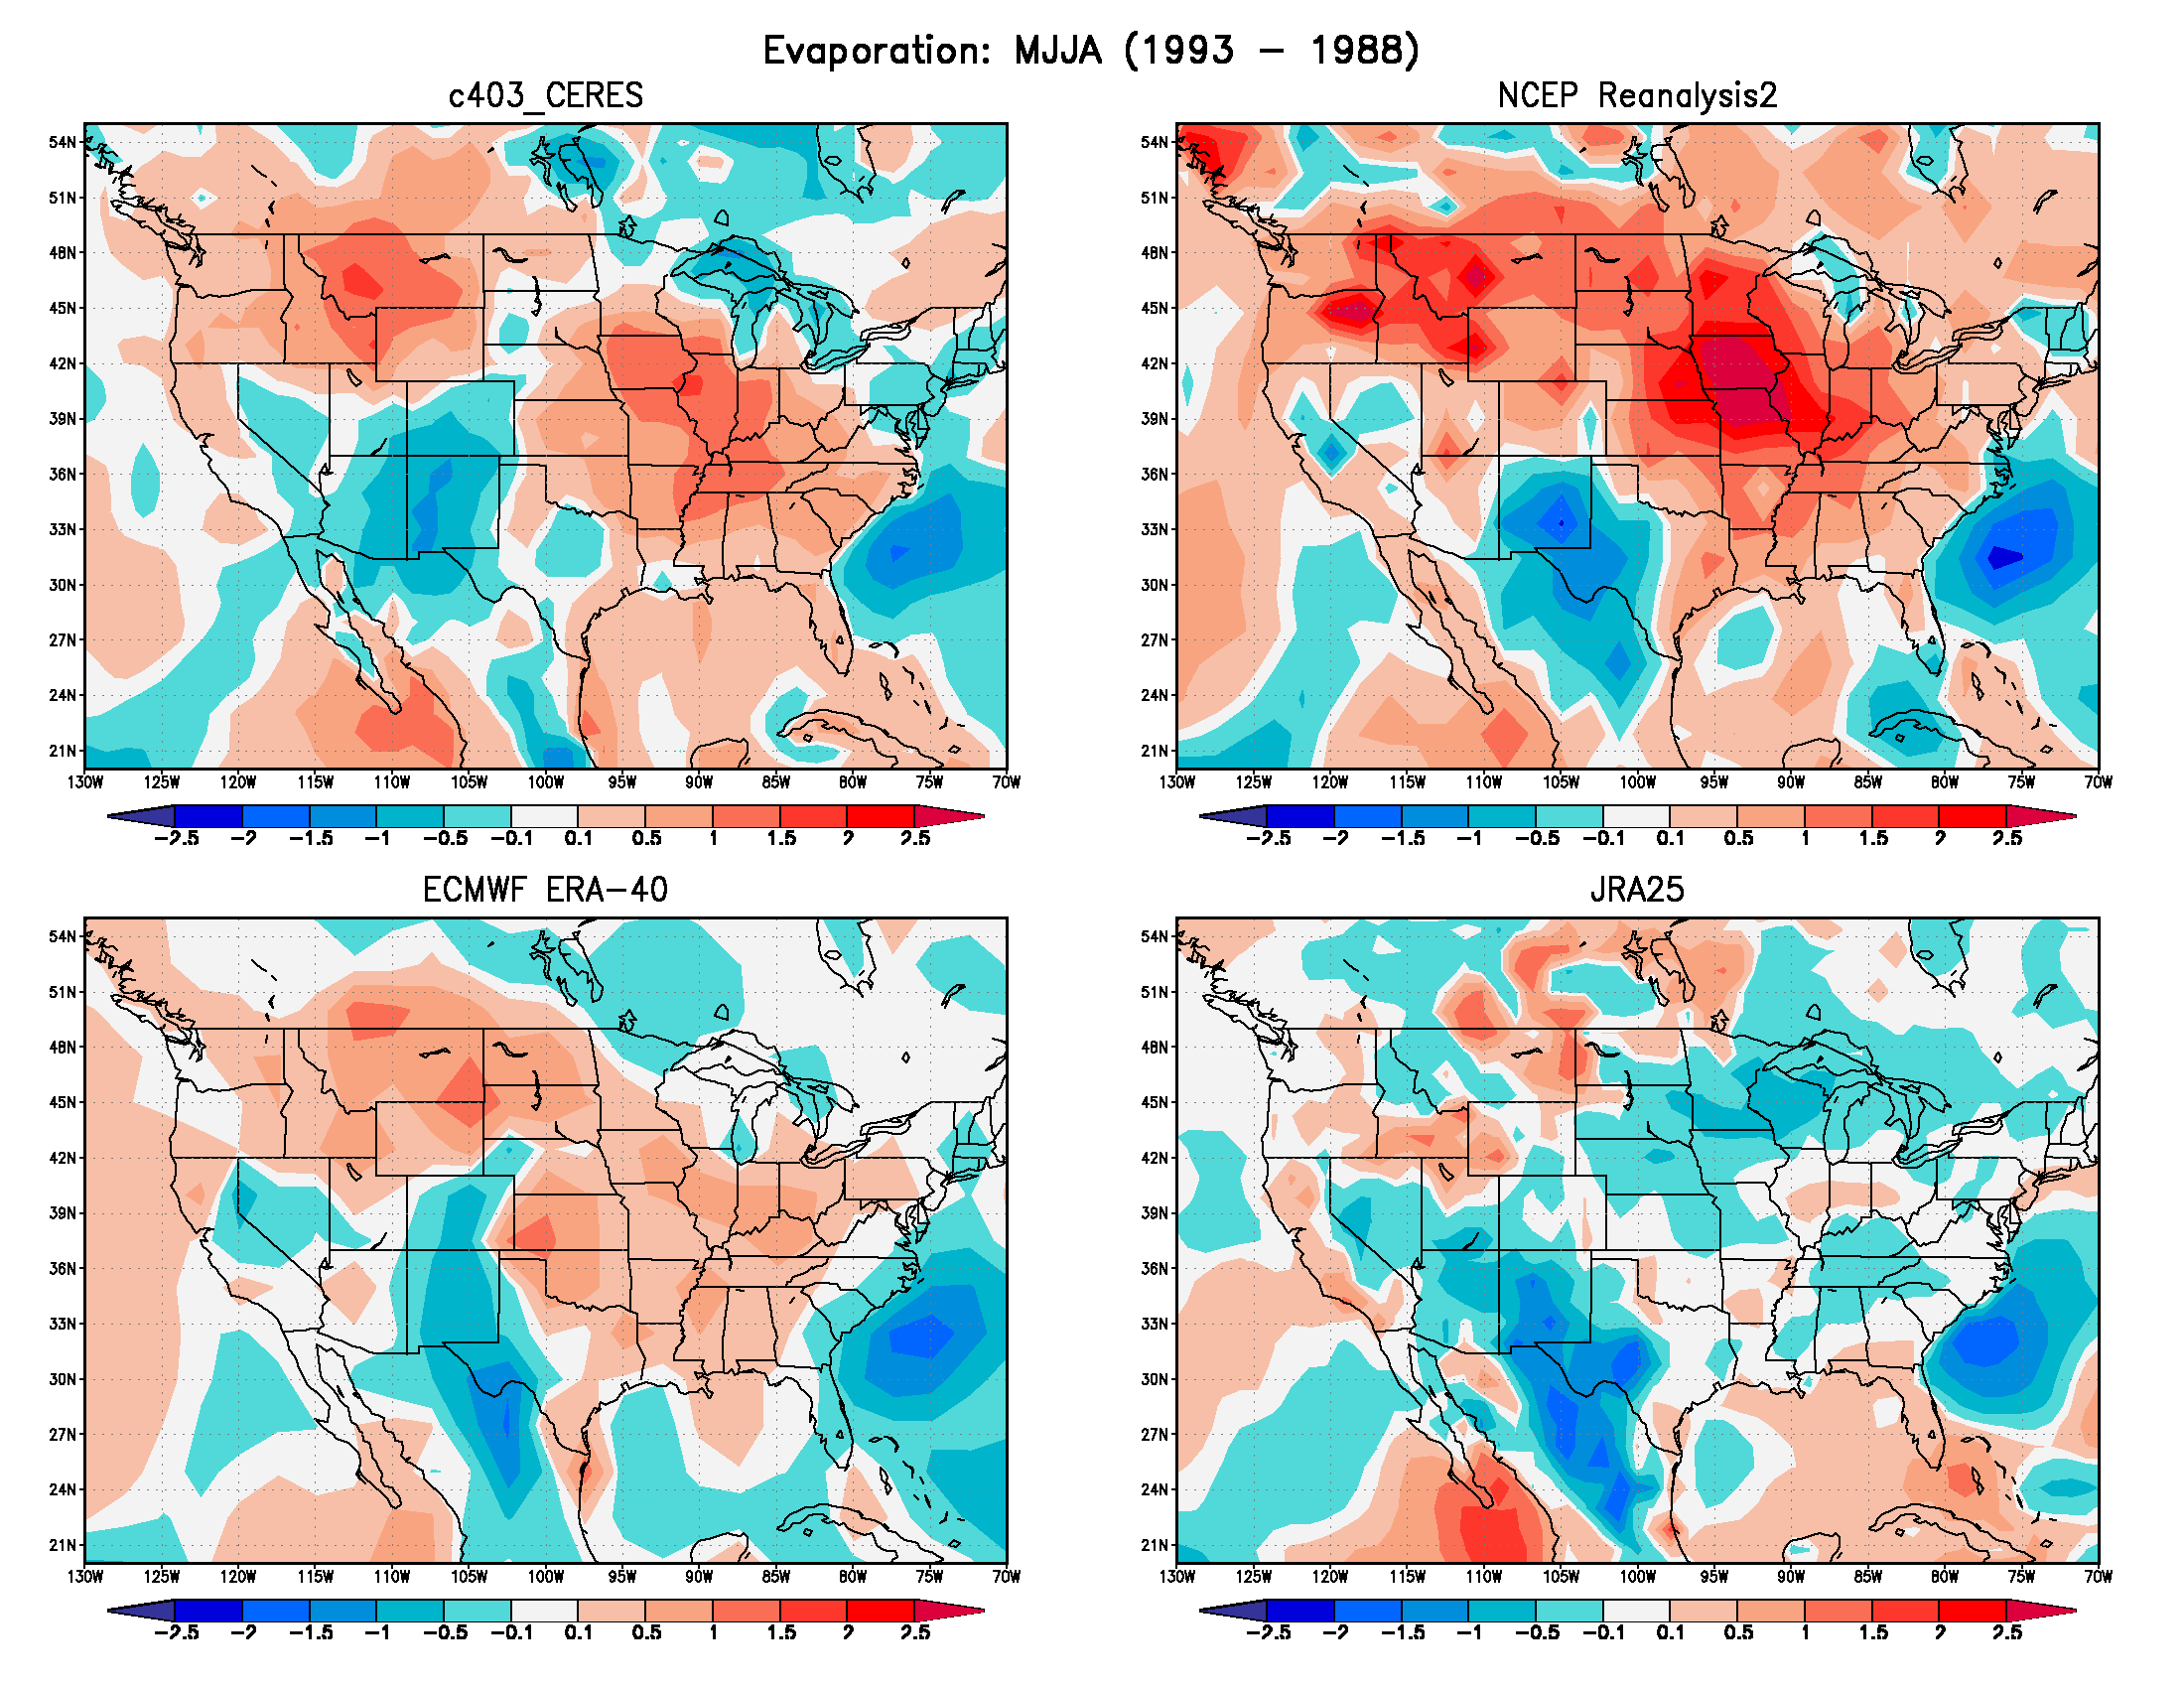
Figure 3. Evap

|
The difference in Evaporation (mm/day)
for the wet (1993) minus dry (1988) season are displayed
for the four data sets
GEOS4-CERES (upper left), NCEP-R2 (upper right),
ERA-40 (lower left), JRA-25 (lower right).
|
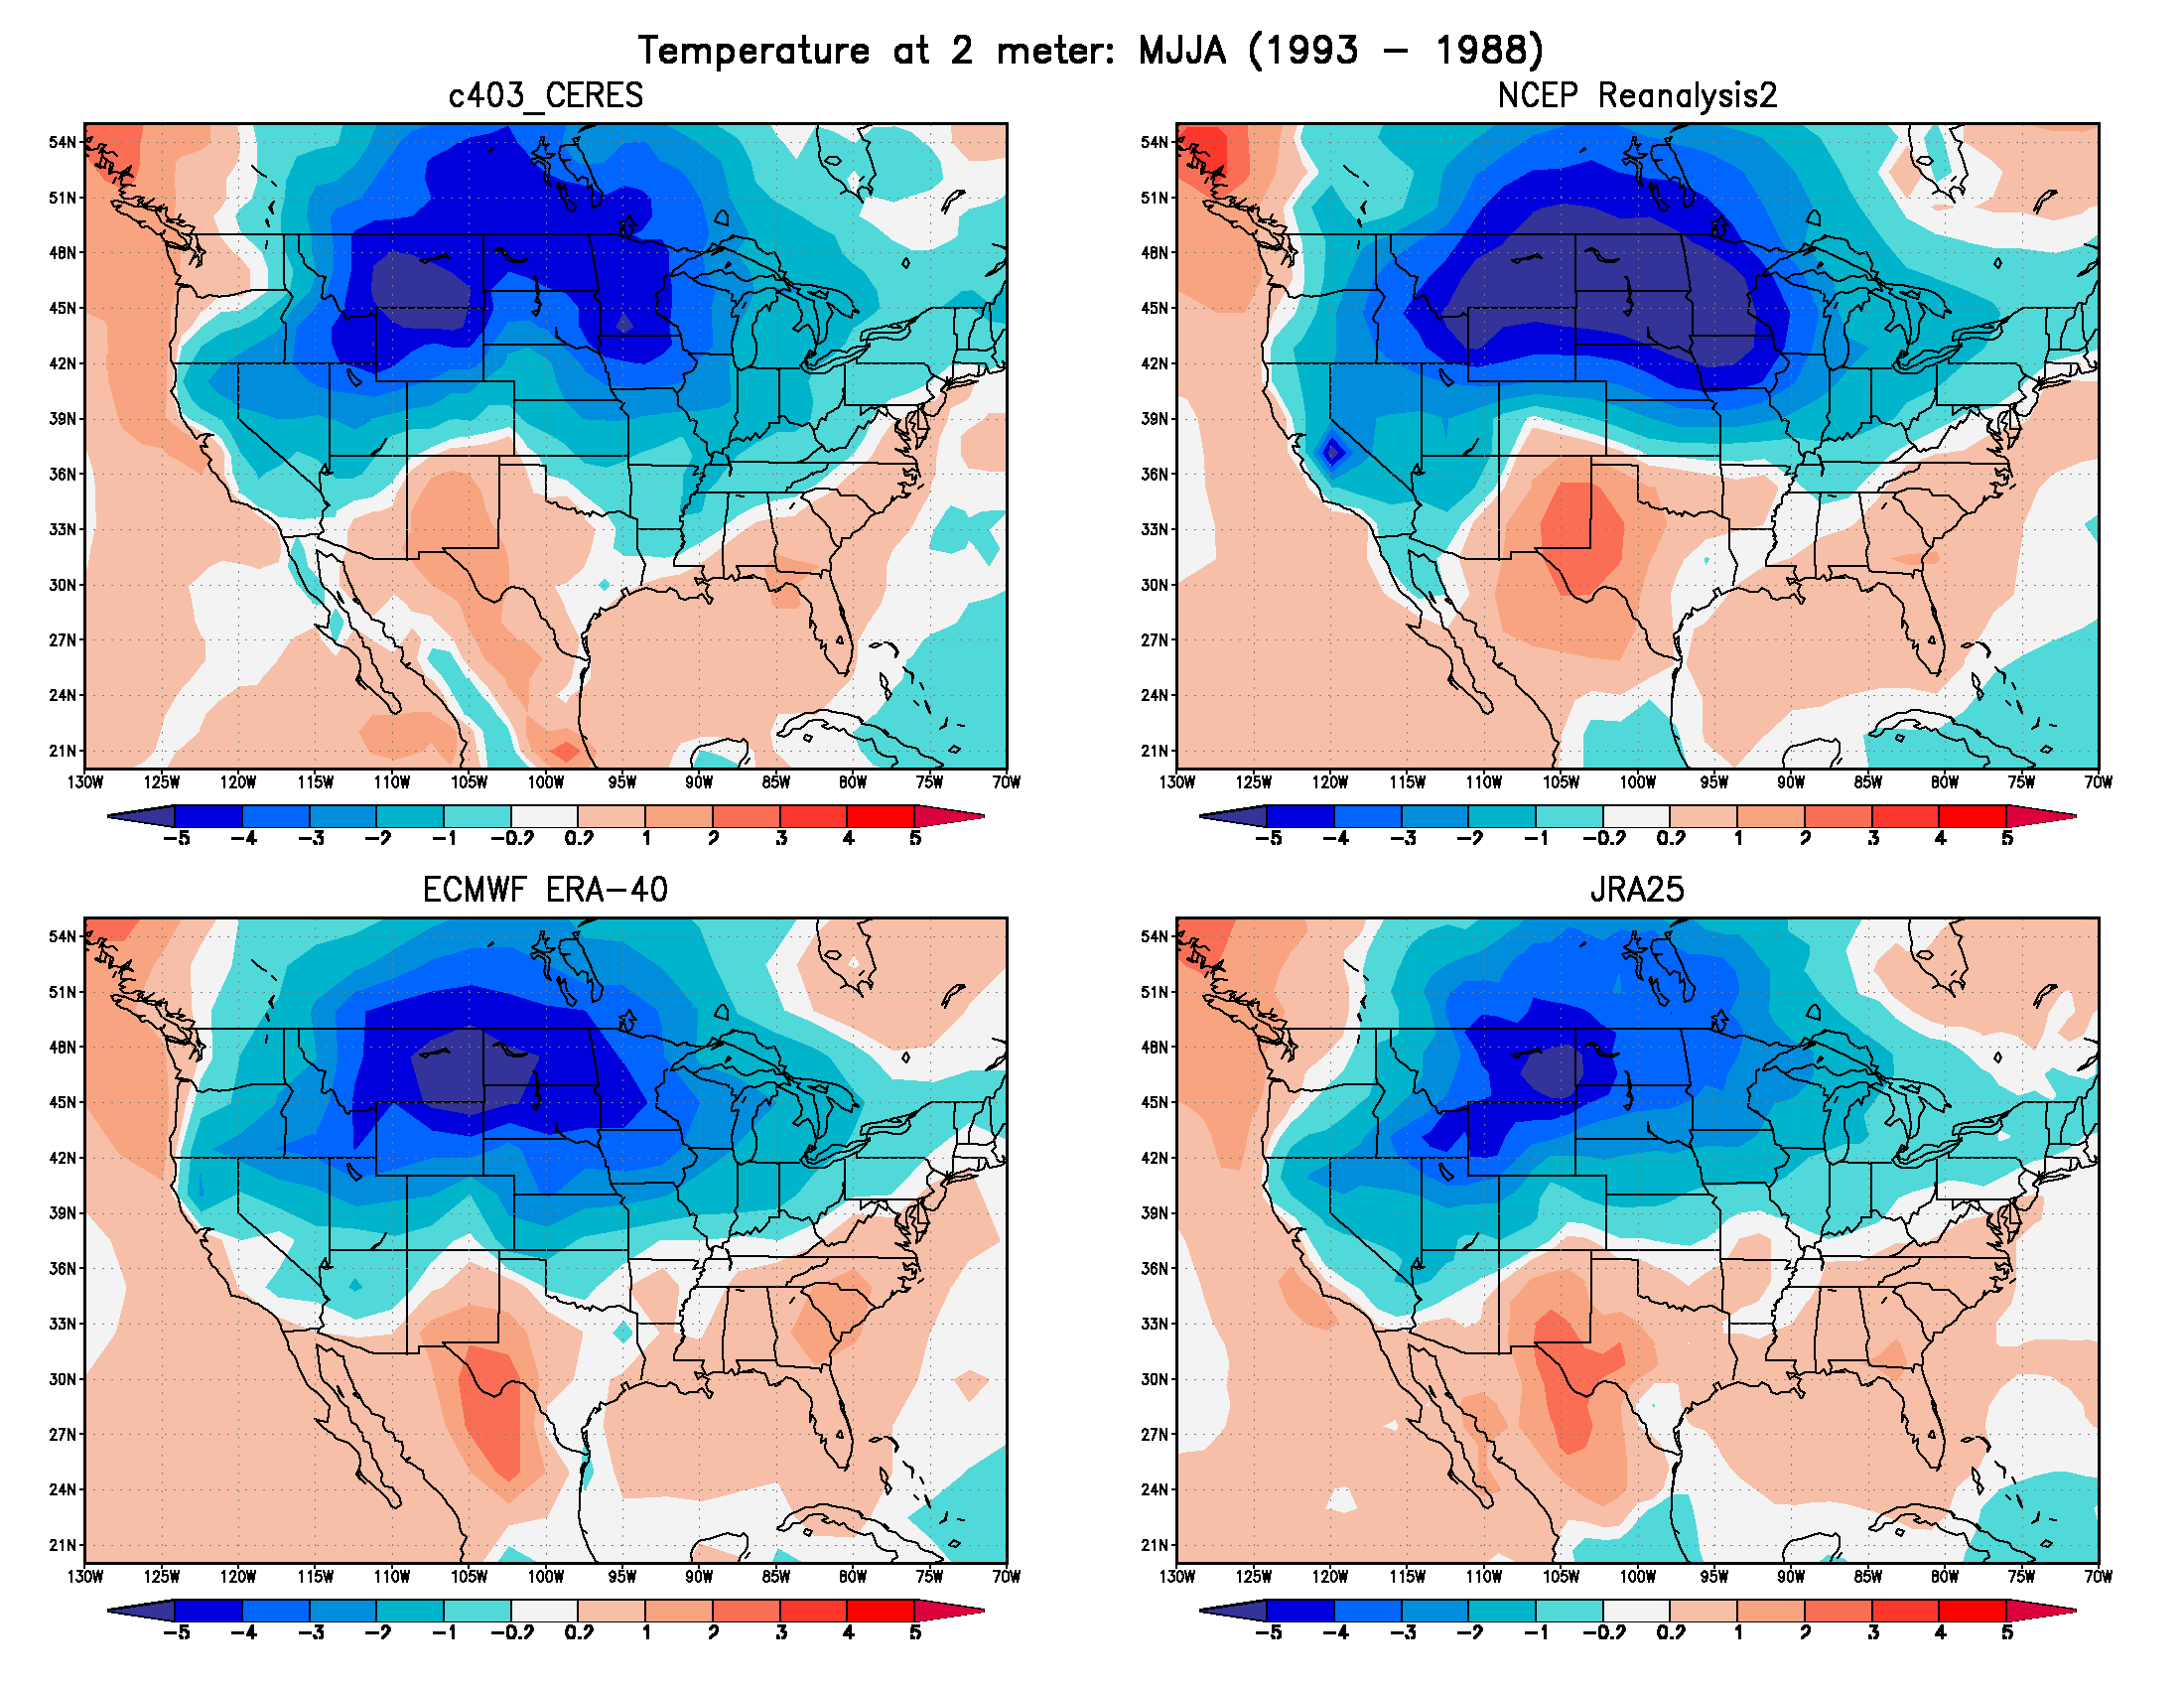
Figure 4. T2m

|
The difference in Temperature (K) at 2 meter
for the wet (1993) minus dry (1988) season are displayed
for the four data sets
GEOS4-CERES (upper left), NCEP-R2 (upper right),
ERA-40 (lower left), JRA-25 (lower right).
|
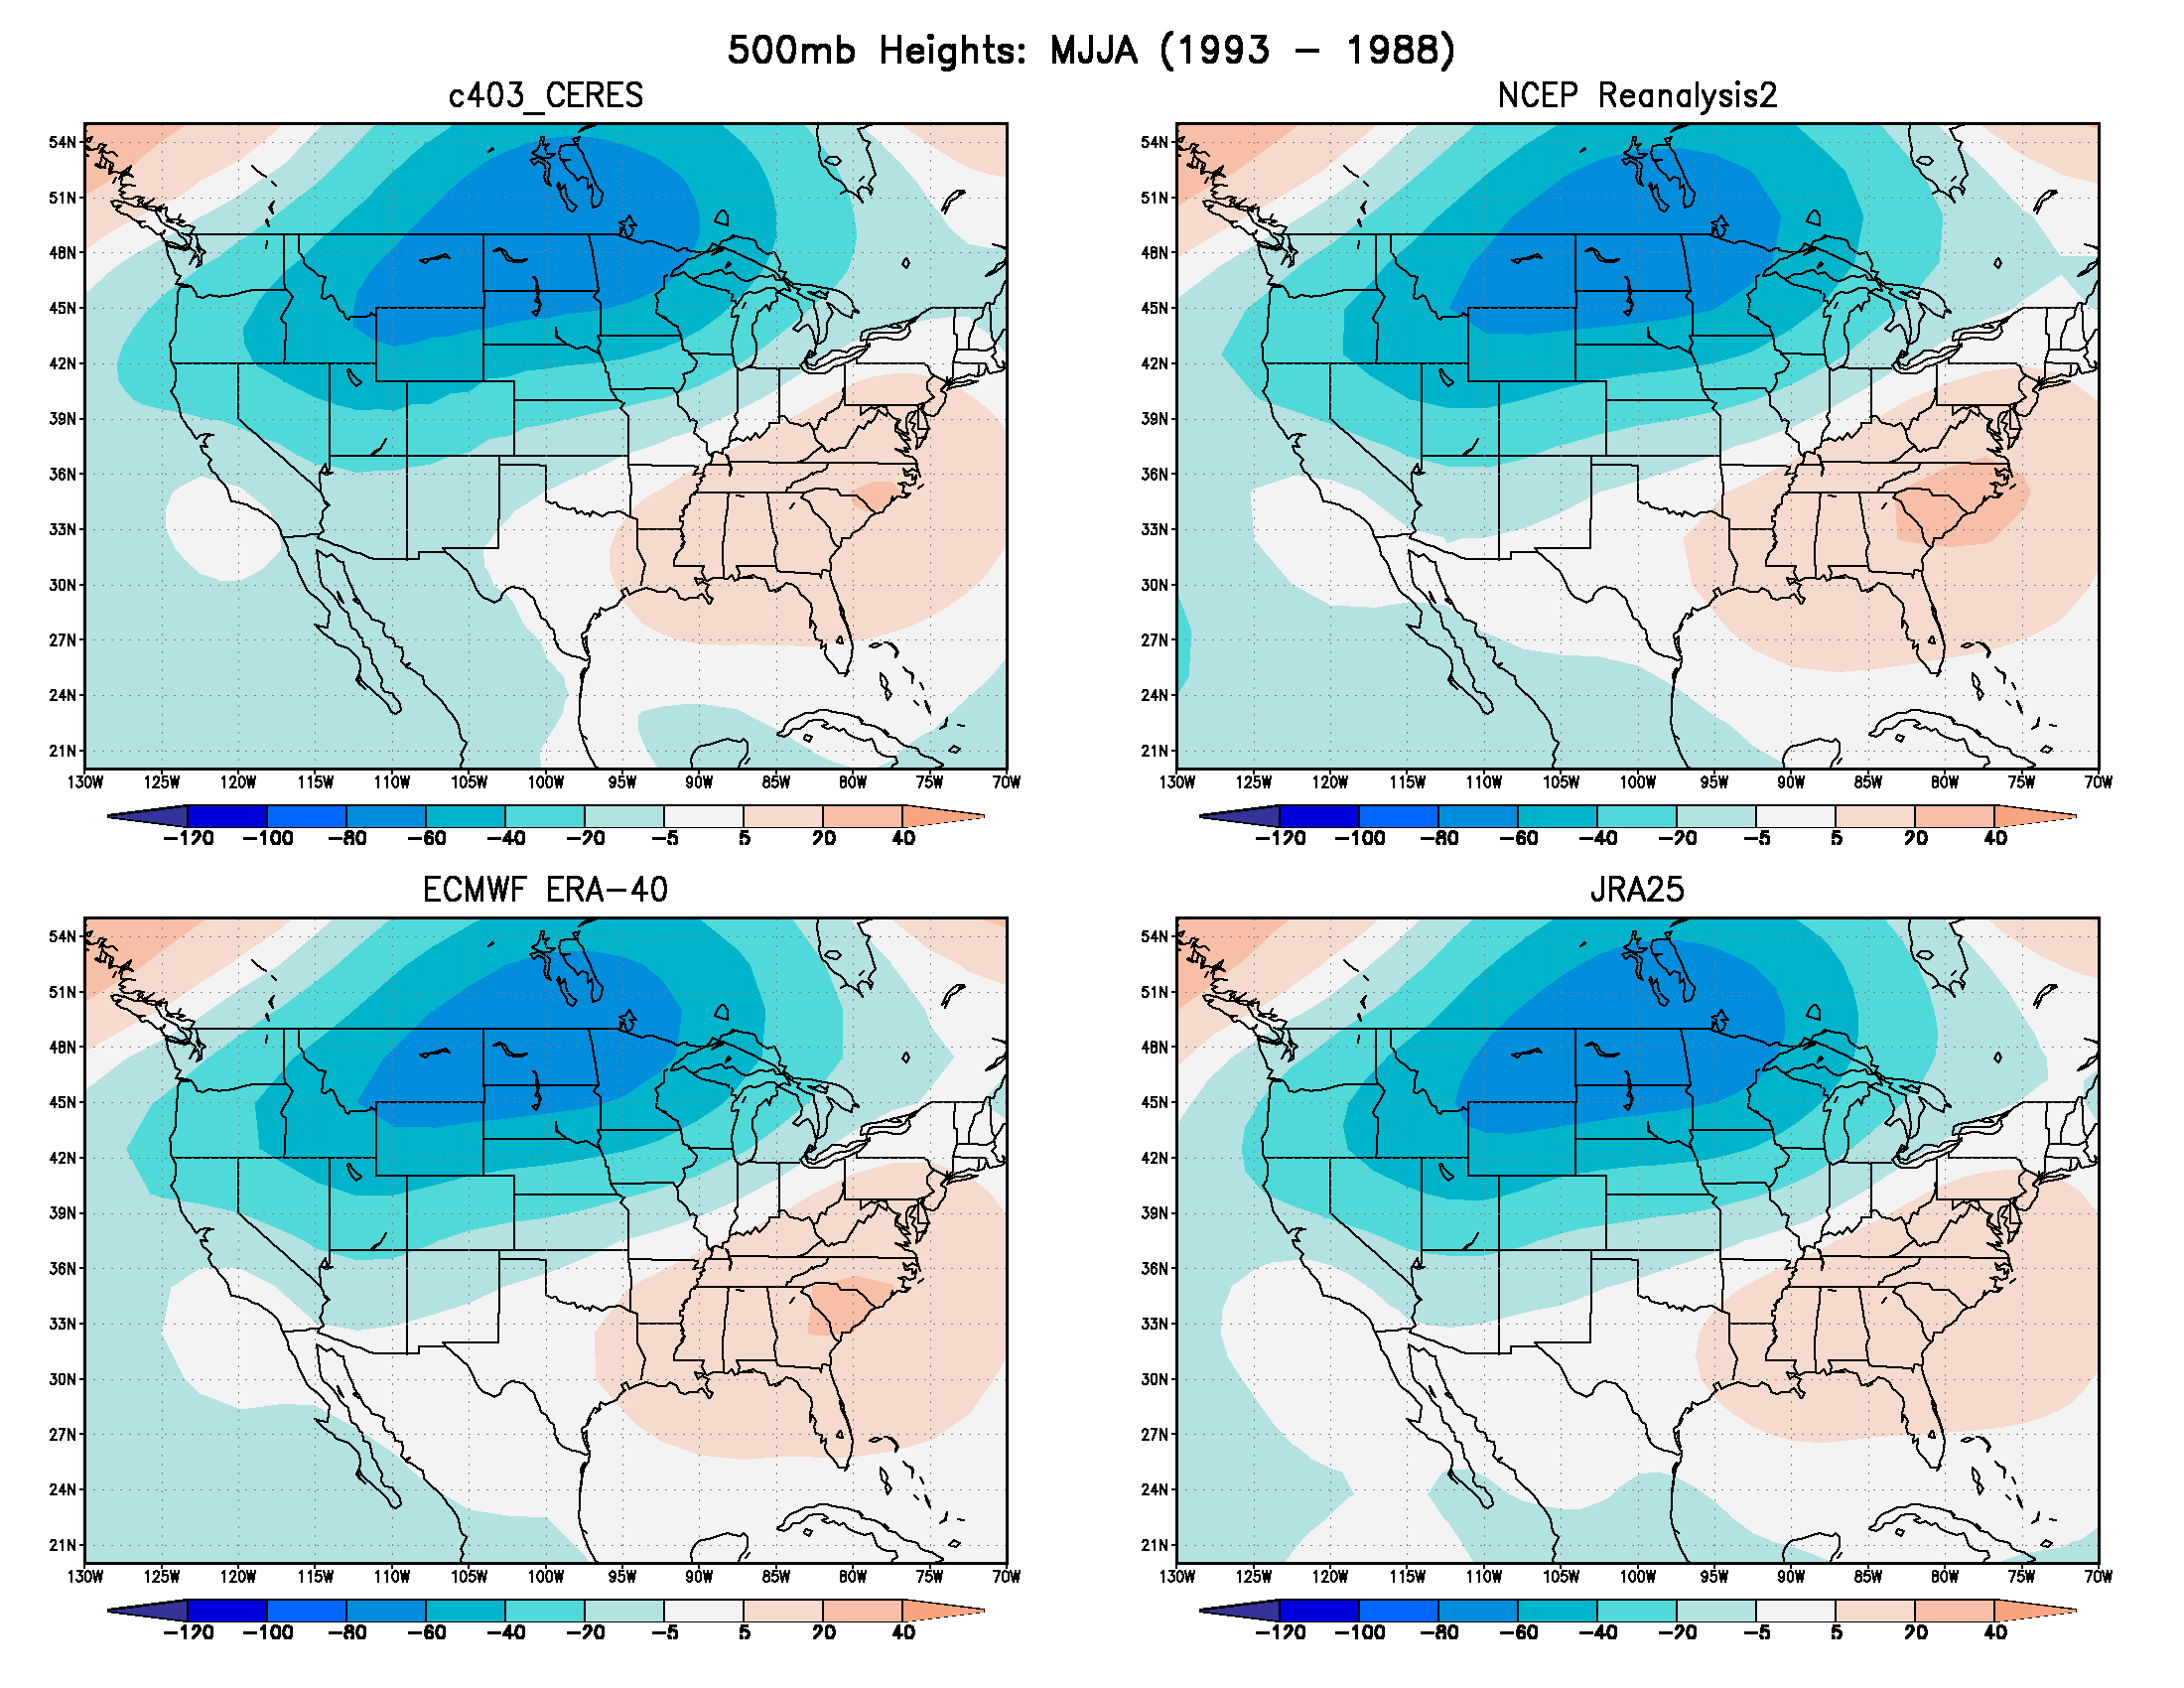
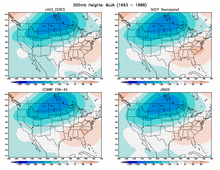
Figure 5. h - 500mb
|
The difference in Heights at 500mb (gpm)
for the wet (1993) minus dry (1988) season are displayed
for the four data sets
GEOS4-CERES (upper left), NCEP-R2 (upper right),
ERA-40 (lower left), JRA-25 (lower right).
|
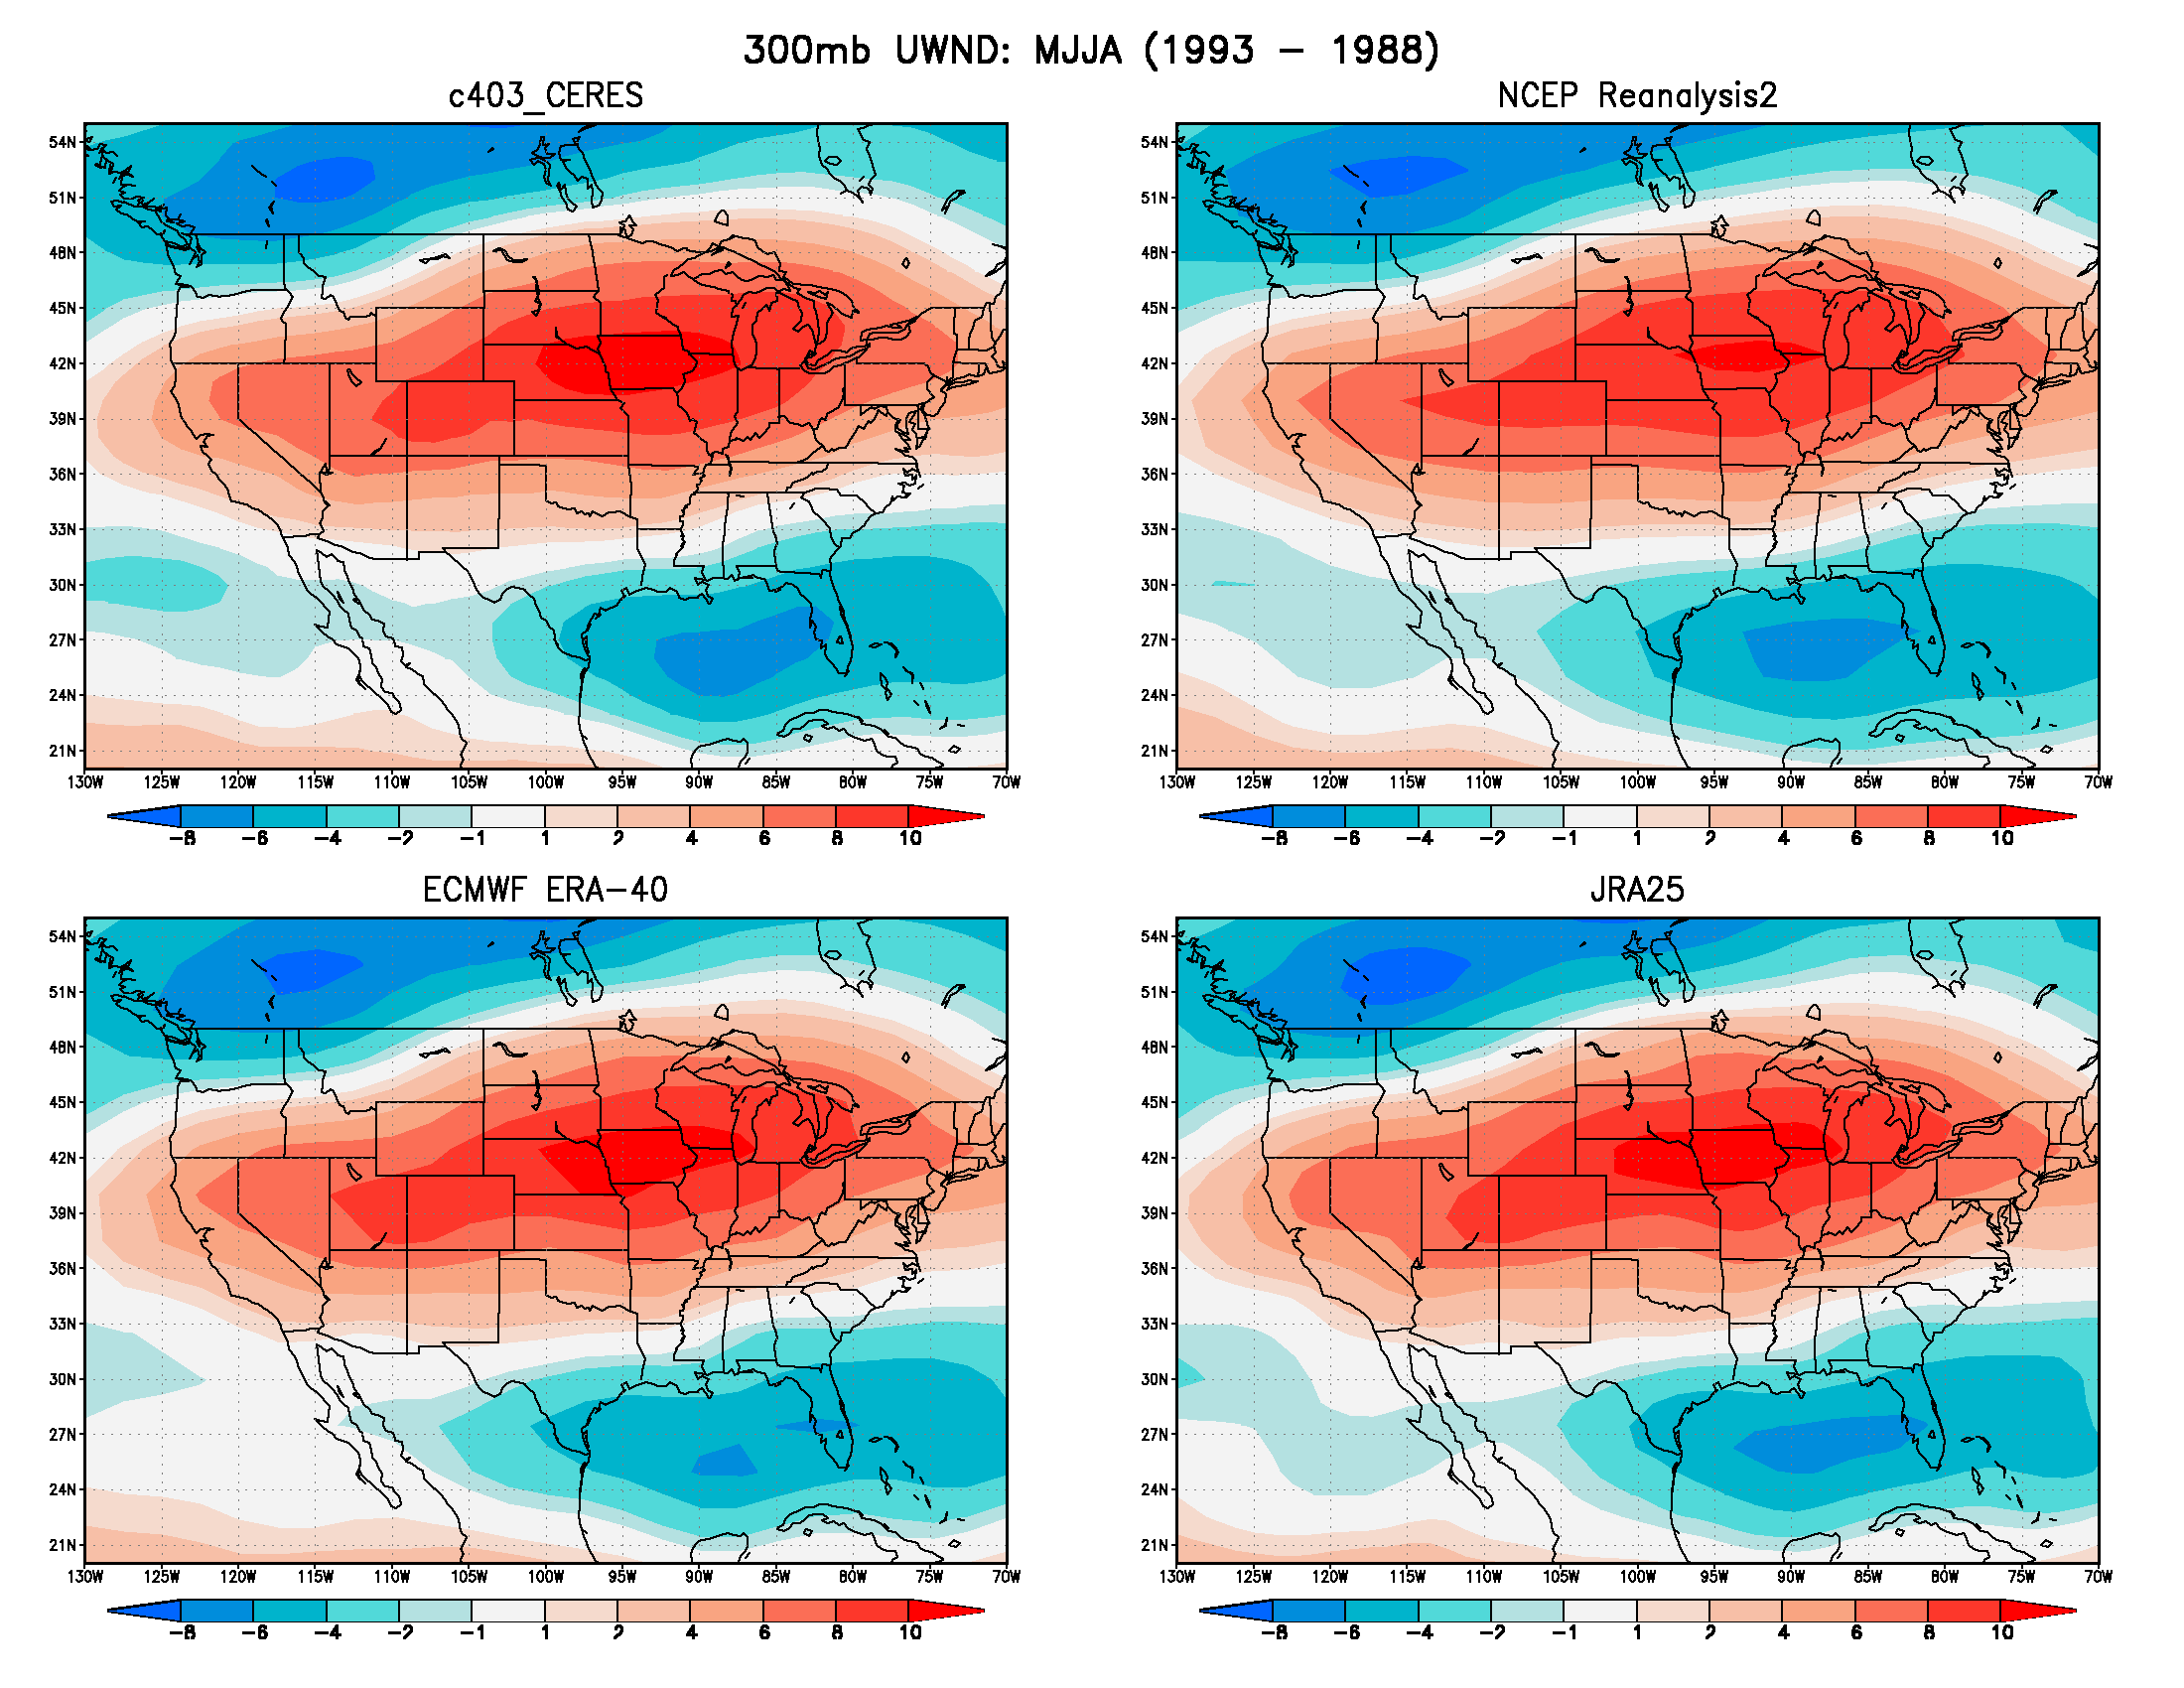
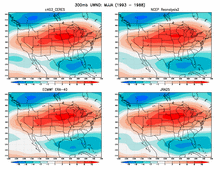
Figure 6. U - 300 mb
|
The difference in U winds at 300 mb (m/s)
for the wet (1993) minus dry (1988) season are displayed
for the four data sets
GEOS4-CERES (upper left), NCEP-R2 (upper right),
ERA-40 (lower left), JRA-25 (lower right).
|
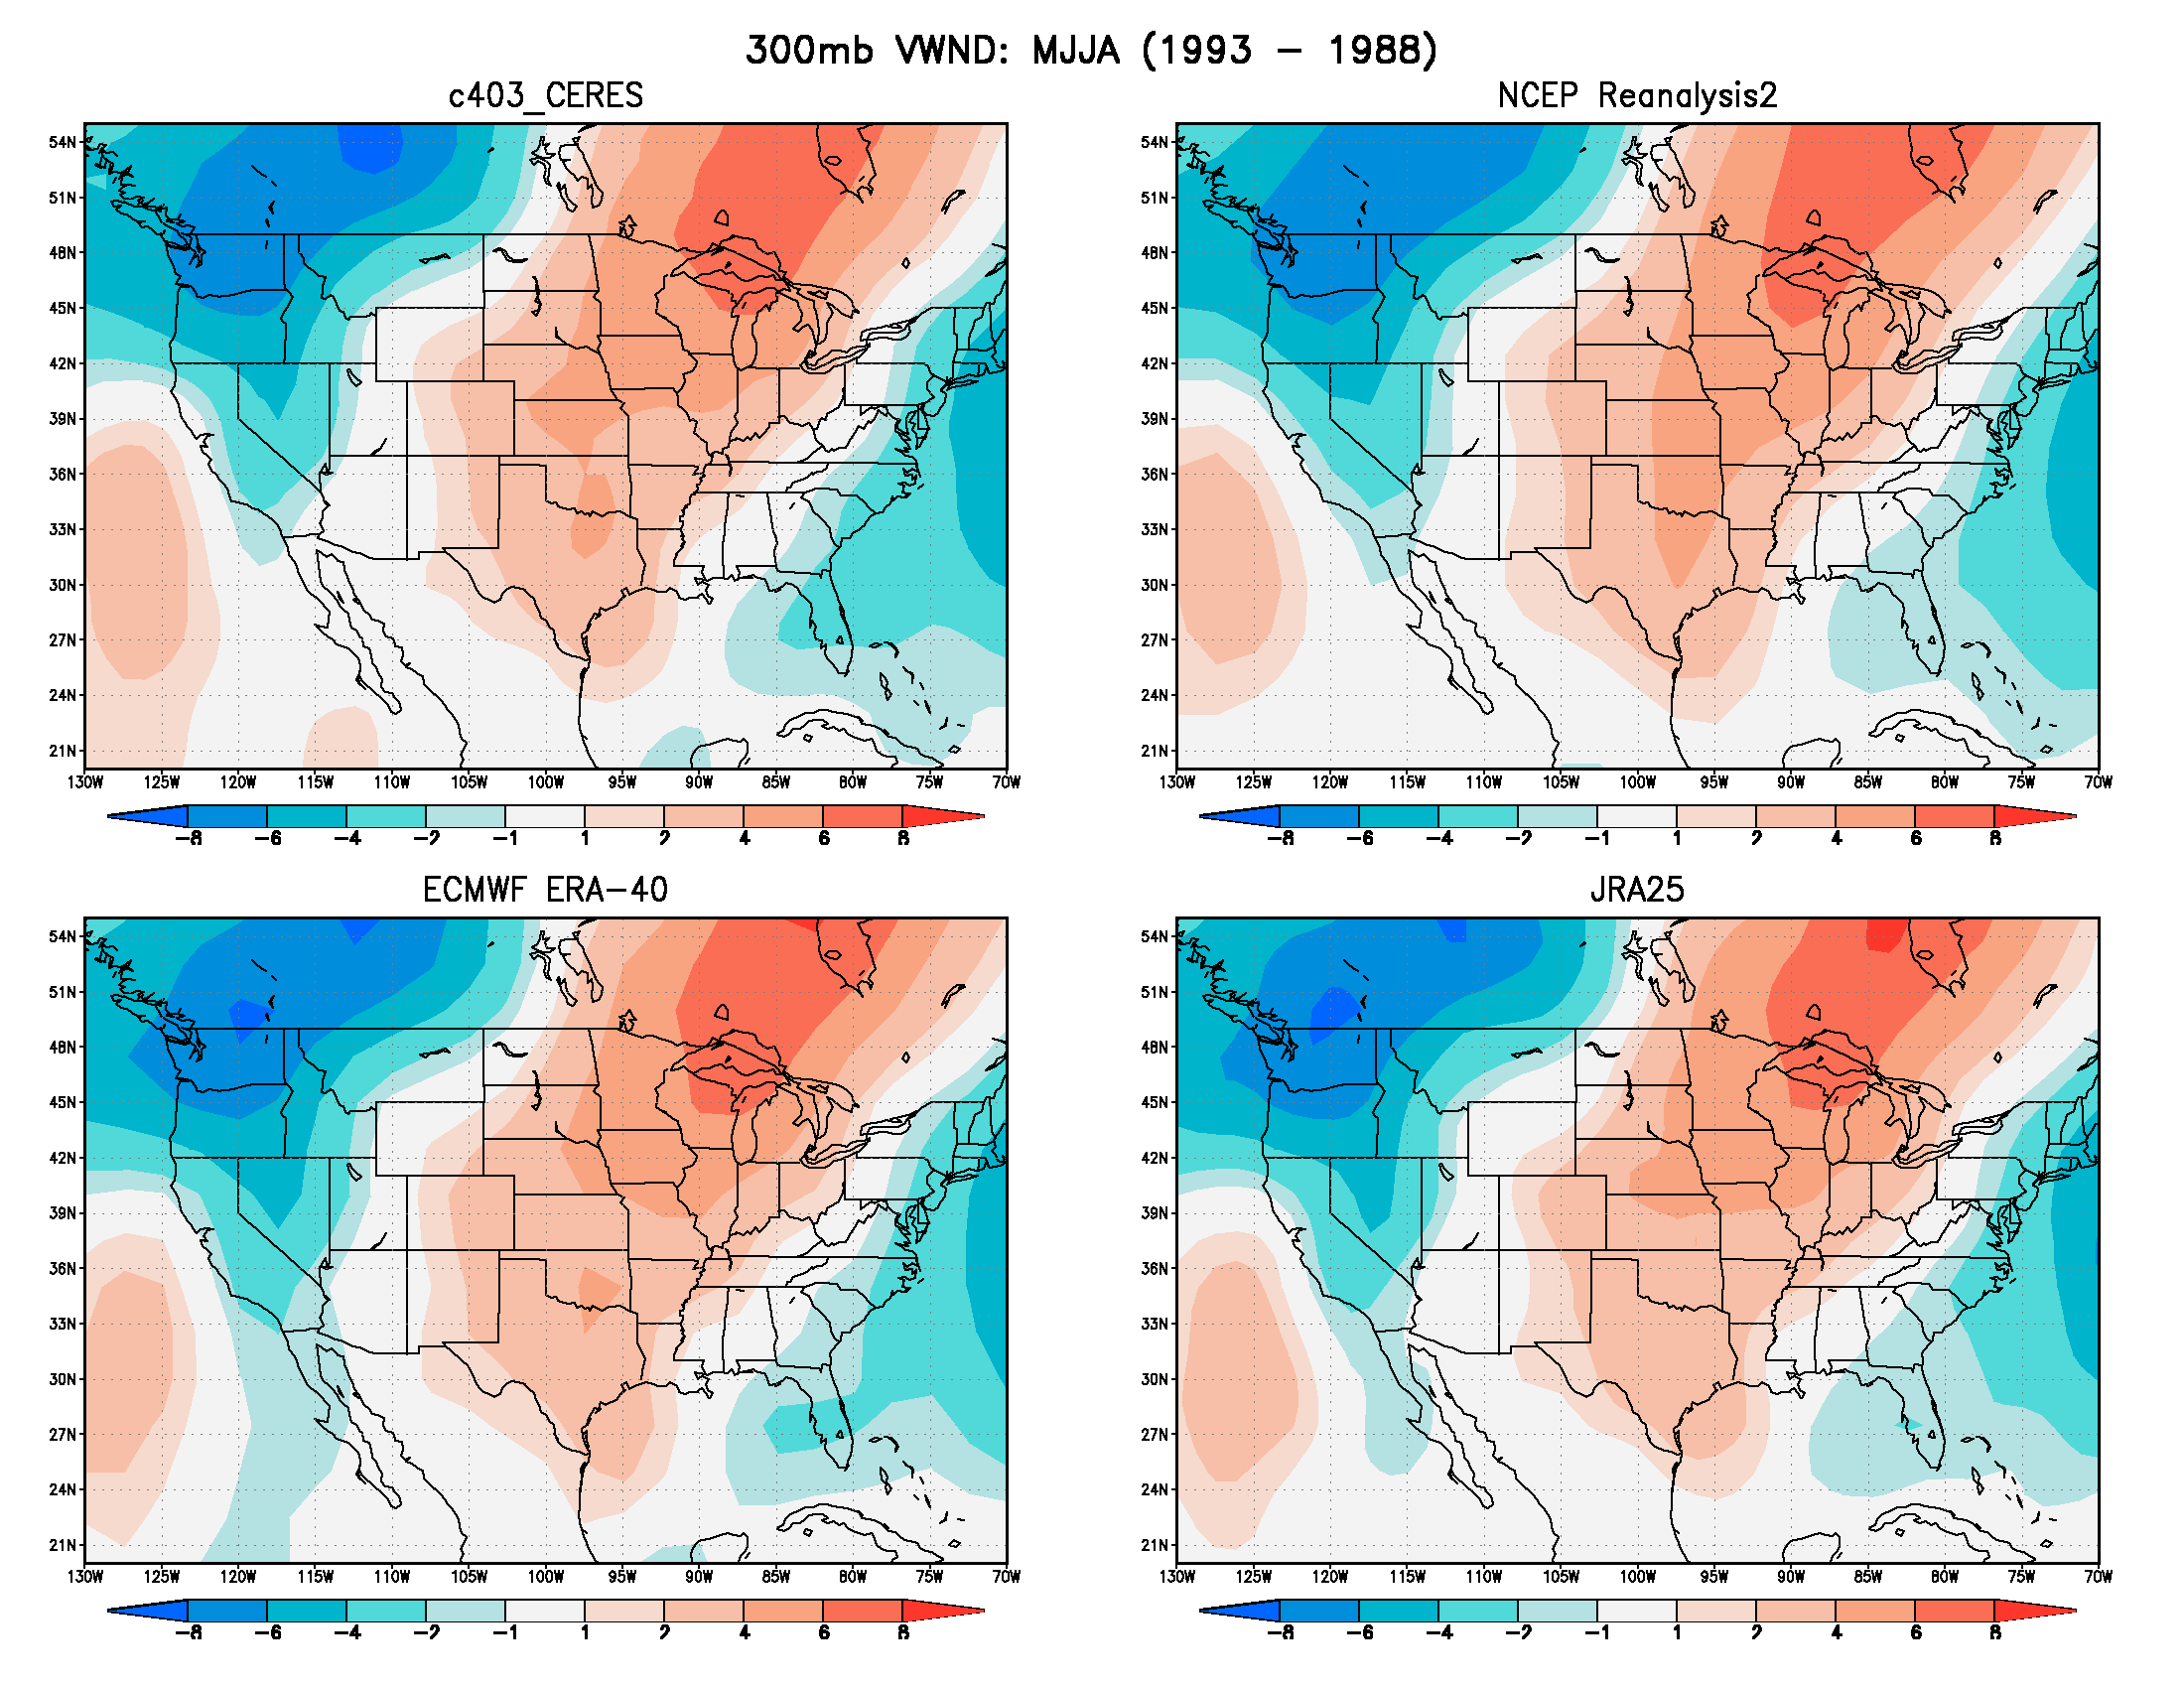
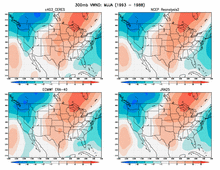
Figure 7. V - 300 mb
|
The difference in V winds at 300 mb (m/s)
for the wet (1993) minus dry (1988) season are displayed
for the four data sets
GEOS4-CERES (upper left), NCEP-R2 (upper right),
ERA-40 (lower left), JRA-25 (lower right).
|
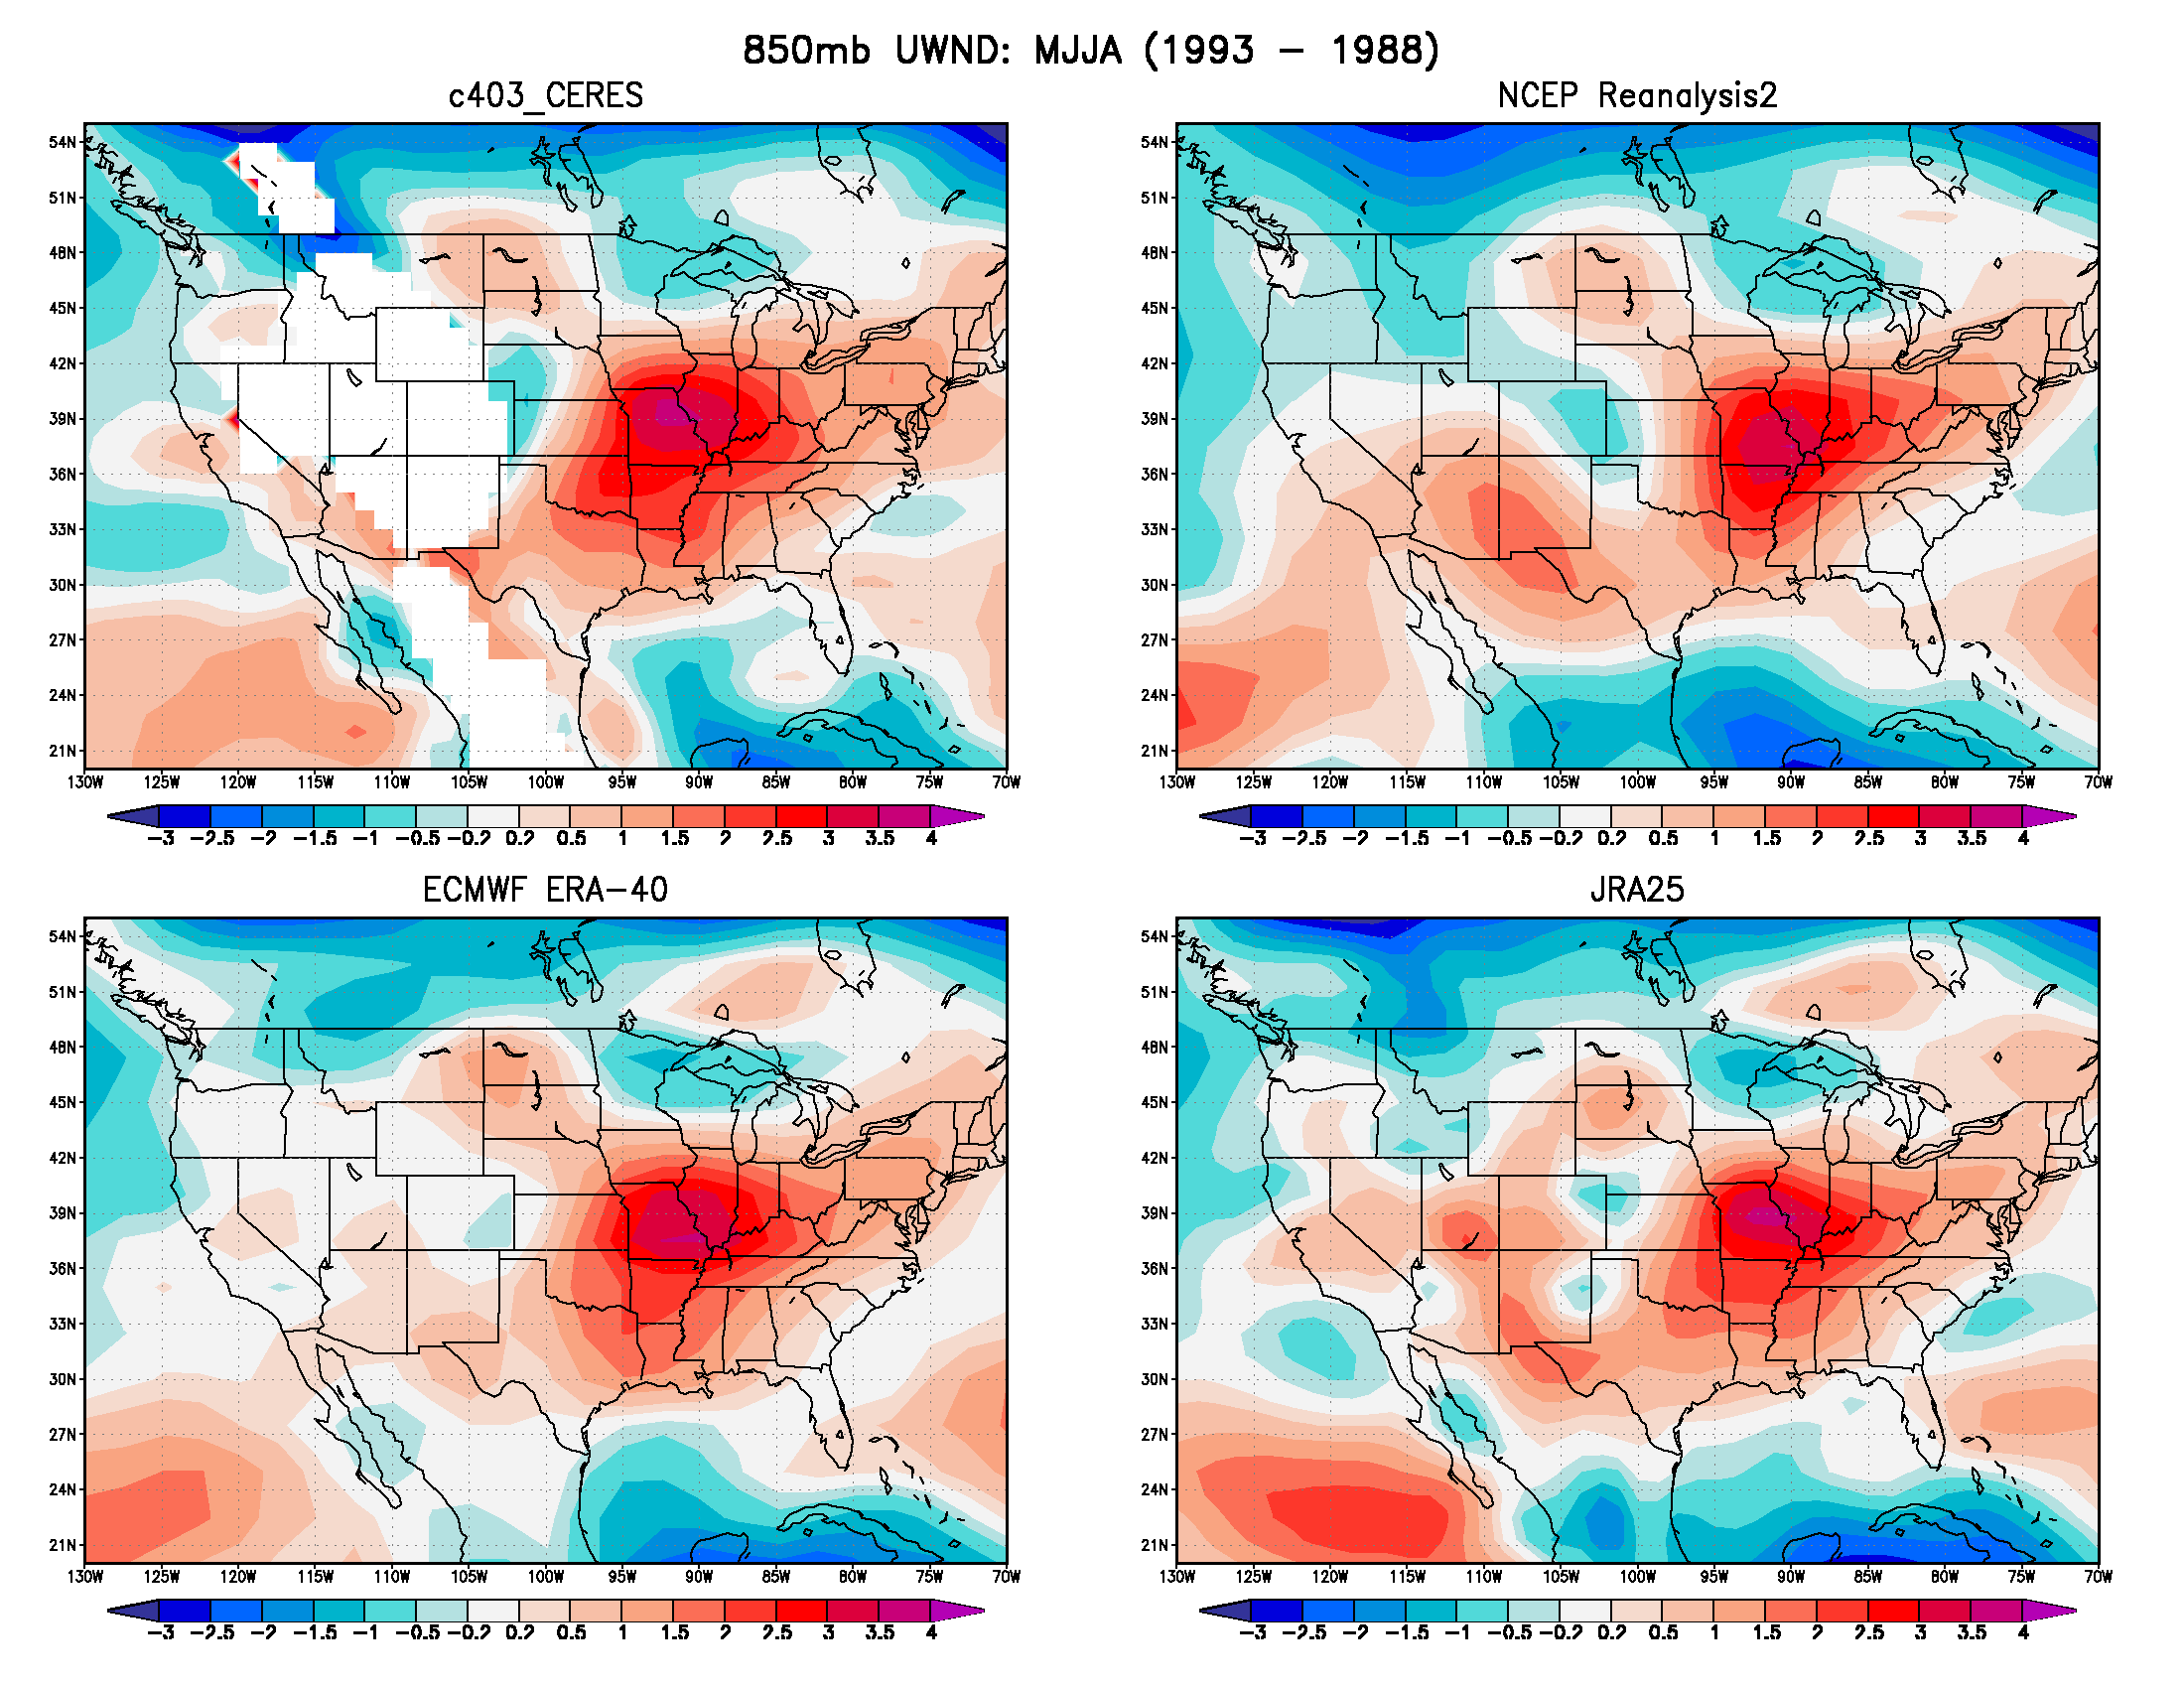
Figure 8. U - 850 mb
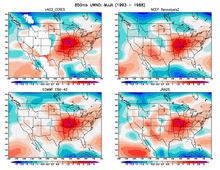
|
The difference in U winds at 850 mb (m/s)
for the wet (1993) minus dry (1988) season are displayed
for the four data sets
GEOS4-CERES (upper left), NCEP-R2 (upper right),
ERA-40 (lower left), JRA-25 (lower right).
|
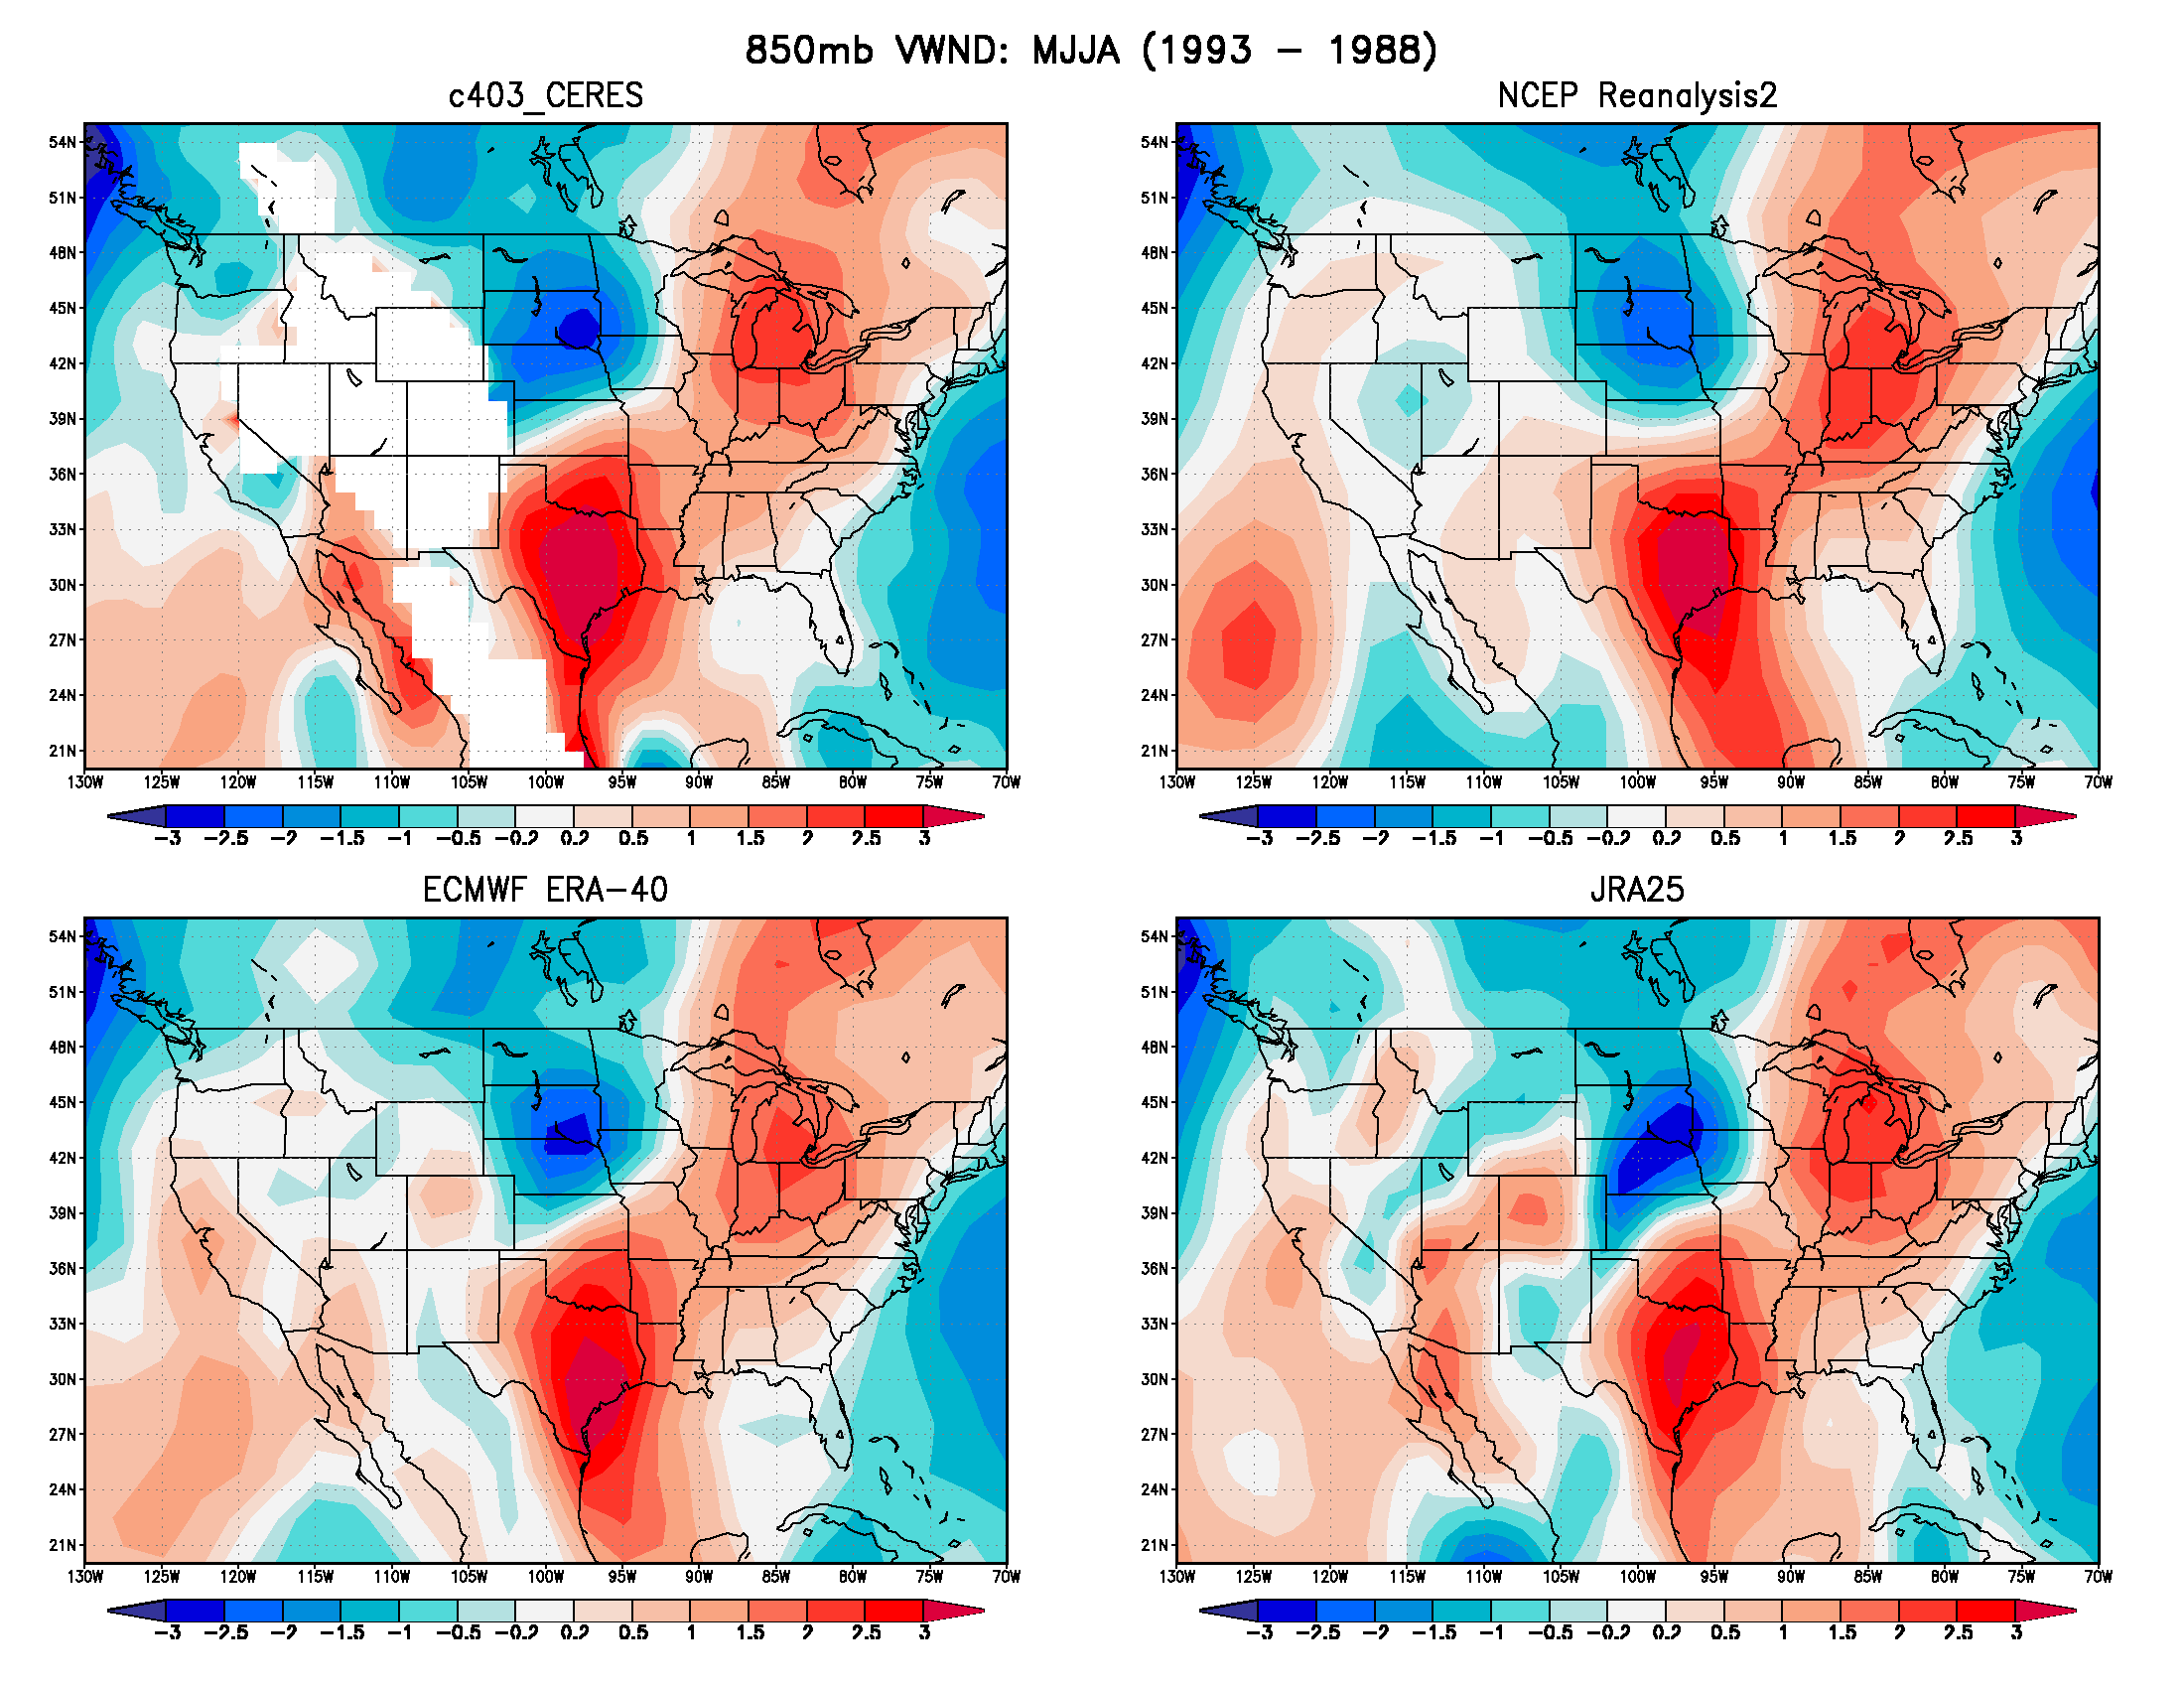
Figure 9. V - 850 mb
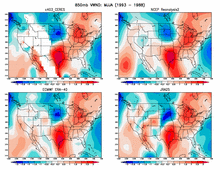
|
The difference in V winds at 850 mb (m/s)
for the wet (1993) minus dry (1988) season are displayed
for the four data sets
GEOS4-CERES (upper left), NCEP-R2 (upper right),
ERA-40 (lower left), JRA-25 (lower right).
|
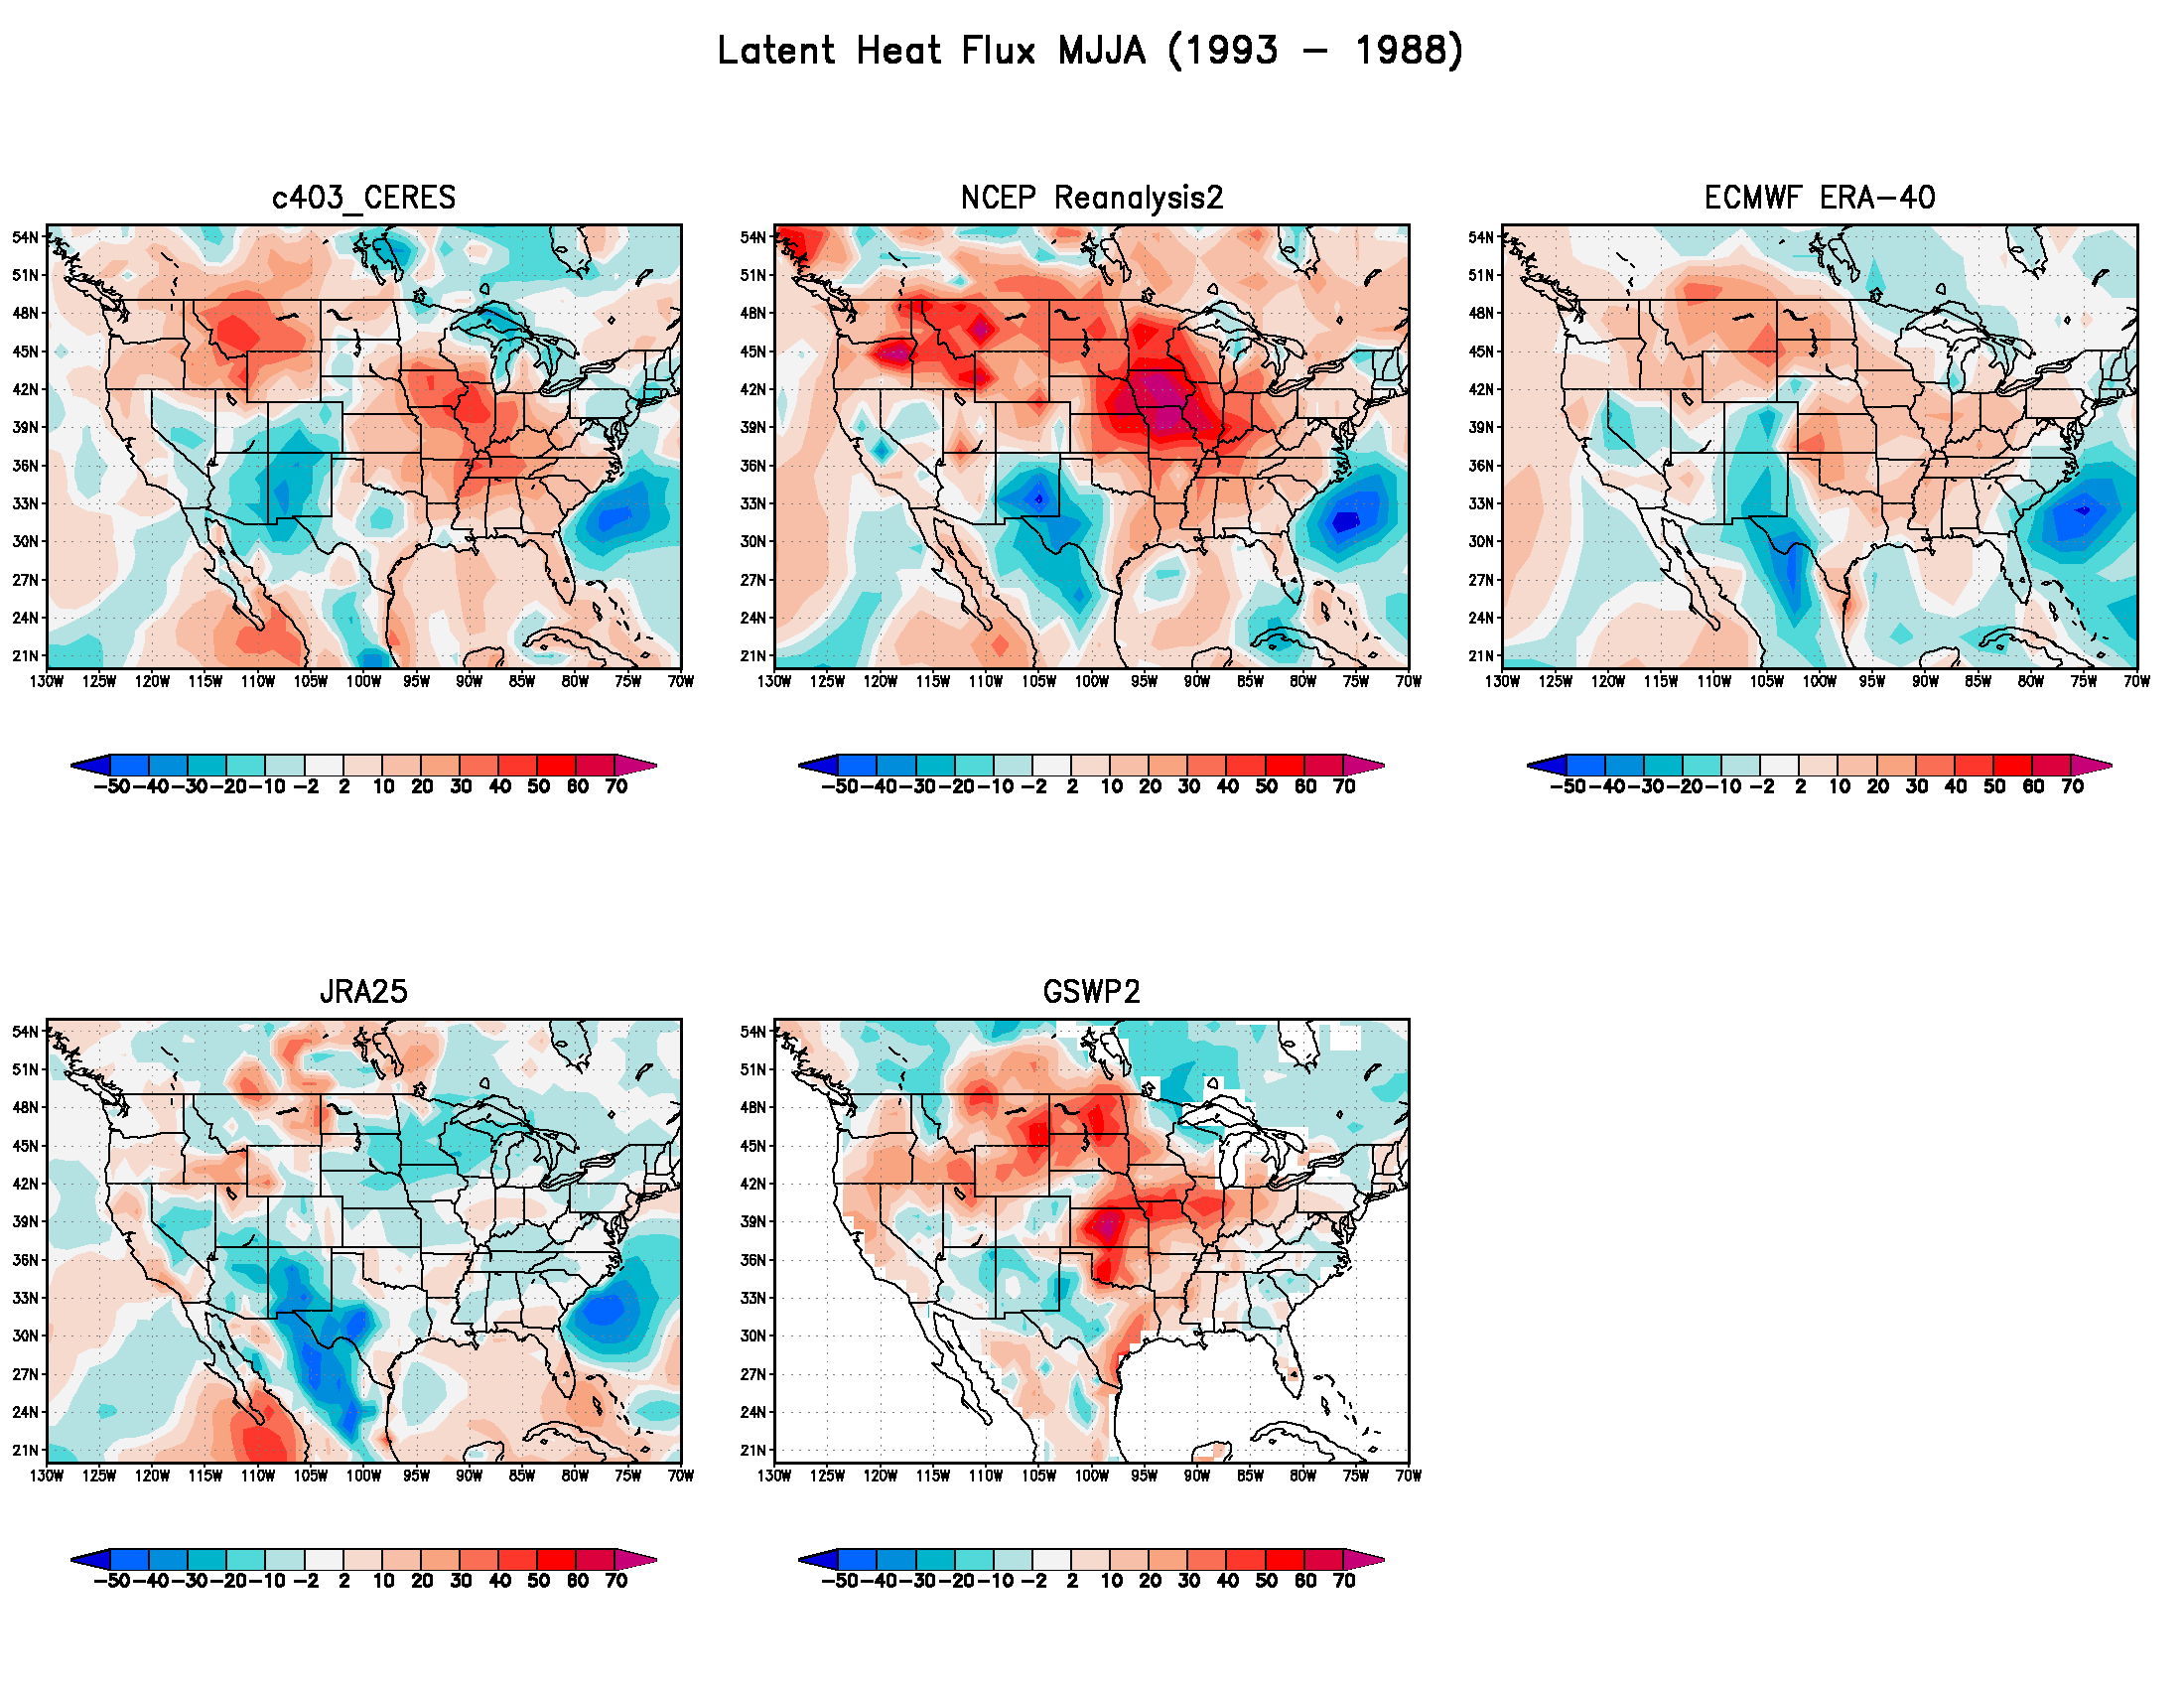
Figure 10. LHF
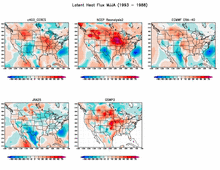
|
The difference in Latent Heat Flux (W/m2)
for the wet (1993) minus dry (1988) season are displayed
for the five data sets
GEOS4-CERES (upper left),
NCEP-R2 (upper middle),
ERA-40 (upper right),
JRA-25 (lower left),
GSWP2 (lower middle).
|
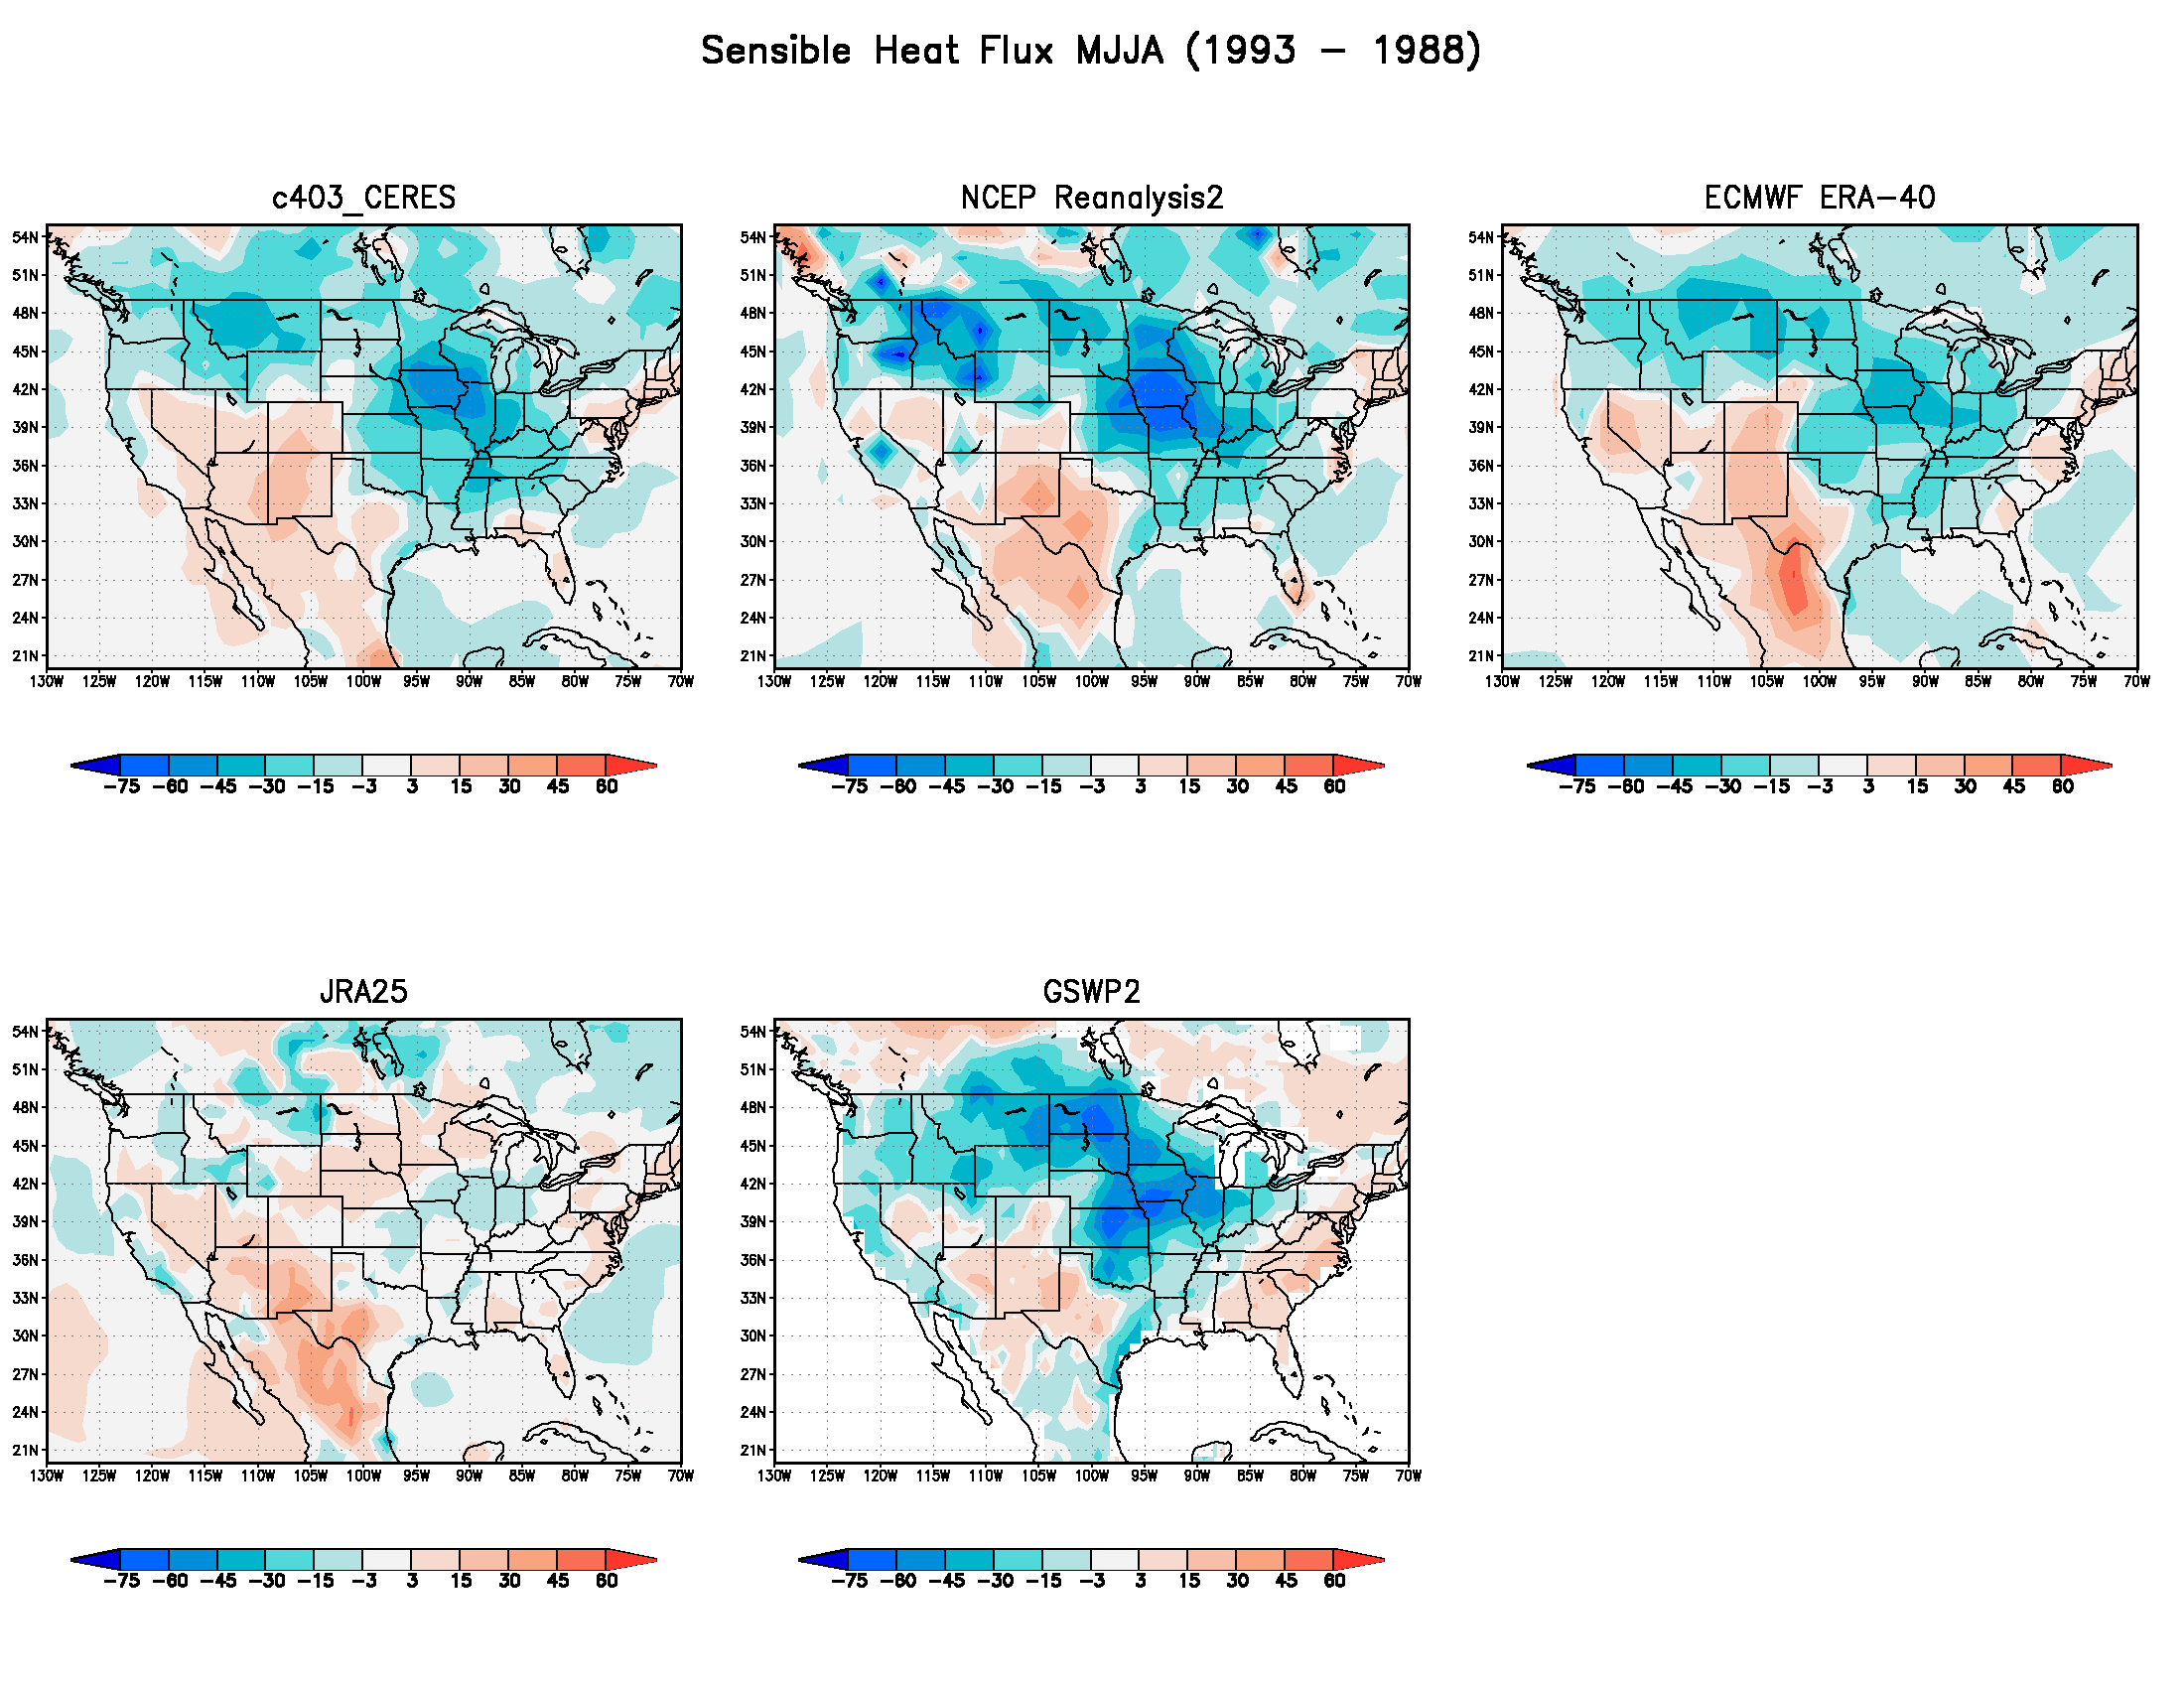
Figure 11. SHF
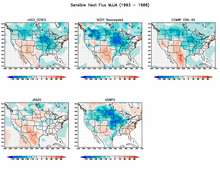
|
The difference in Sensible Heat Flux (W/m2)
for the wet (1993) minus dry (1988) season are displayed
for the five data sets
GEOS4-CERES (upper left),
NCEP-R2 (upper middle),
ERA-40 (upper right),
JRA-25 (lower left),
GSWP2 (lower middle).
|
Back to top of page
« MERRA Main Page
|
|