
Quantifying the observability of CO2 flux uncertainty in atmospheric CO2 records using products from NASA's Carbon Monitoring Flux Pilot Project
October 2014
Lesley Ott
Atmospheric carbon dioxide (CO2) is a powerful greenhouse gas whose concentration in the atmosphere is steadily increasing as the result of human activities. About half of the emitted CO2 remains in the atmosphere while the other half is absorbed by plants and by the world’s oceans. Though estimates of human emissions are considered fairly reliable, the processes that control the flux of carbon between the atmosphere and plants and oceans are less well understood. This poses a challenge to model projections of the rate of climate change; if modelers can not represent how much carbon is taken out of the atmosphere by natural processes, they can not predict how fast CO2 will accumulate in the atmosphere and how rapidly the planet will warm in response.
NASA's Carbon Monitoring System was designed to better understand how well current satellite observations constrain land and ocean carbon flux estimates. Land and ocean flux are calculated by separate models which use a number of datasets as input. Land models often use satellite information including measurements of vegetation greenness, estimates of burned area, and estimates of the amount of light absorbed by a plant canopy. Ocean models use estimates of ocean color, which indicates the presence of phytoplankton, and measurements of sea surface temperature. Both land and ocean models use information from atmospheric reanalyses, products that combine information from models and observations from a number of weather satellites. These flux estimates are then used by atmospheric models to produce maps of atmospheric carbon dioxide which can be evaluated against CO2 observations from ground-based stations, satellites, and aircraft; through this evaluation process, scientists aim to attribute mismatches between CO2 data and models to improve the original flux estimates.
Several previous experiments have focused on comparing dozens of different land and ocean flux estimates. Our study focused on comparing two sets of realistic land and ocean fluxes using a single atmospheric model to understand more deeply 1) why differences in flux existed despite the large quantities of satellite data used as input and 2) how well different types of atmospheric CO2 observations were able to discern these flux differences. Land fluxes used different satellite datasets as input and also included different processes — for example, one included emissions from fires while the other did not. These differences add up to 1.7 Pg C — an amount about 20% as large as global total fossil fuel emissions. Ocean models also use different satellite datasets and very different models of ocean circulation and biogeochemistry. As a result, global total atmosphere-ocean flux differed by 35% with particularly large disagreements at high latitudes.
NASA's GEOS-5 model was used to transport the different flux estimates through the atmosphere, and results were compared with surface, aircraft, and satellite estimates. We used a statistical criteria based on the variability within observational CO2 records to determine when a difference caused by flux would be large enough to distinguish from natural variability due to weather. Surface observations are primarily taken in remote locations; as a result they would be able to detect only a difference in the timing of the seasonal cycle between the two land flux models. Information on spatial differences or specific processes like fires was not readily observed by surface observations because they are taken far away from source regions. Surface observations in the mid- and high latitudes of the southern hemisphere were able to detect the strong difference in Southern Ocean CO2 flux estimated by the two models, but ocean flux differences in all other locations were indistinguishable from natural variability in the measurements.
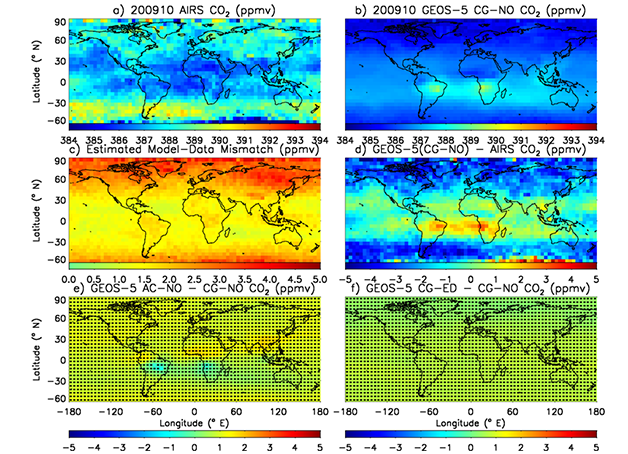
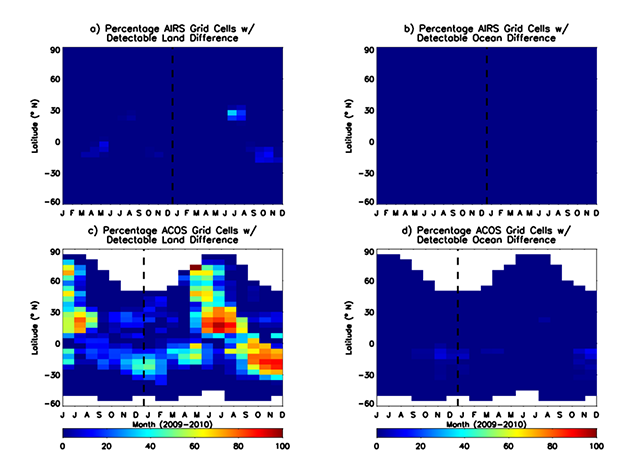
Results were also compared with CO2 observations from two satellites: AIRS, which observes in the mid- and upper troposphere (about 5 to 15 km above Earth's surface), and the Japanese satellite GOSAT, which observes the total column of CO2. AIRS data provide excellent coverage because they use techniques to remove the influence of clouds from data, but measurements are characterized by a great deal of variability. Because land and ocean flux at these altitudes appear as small concentration differences, AIRS would not be able to distinguish between the land and ocean fluxes examined (Figure 1). GOSAT observations provide greater sensitivity to near surface CO2, where flux differences appear the largest, but because observations are not taken when clouds are present, data are very sparse. This limits the utility of GOSAT data in differentiating between flux estimates. Information on the seasonal cycle of land fluxes was likely to be detected, but spatial information on where flux errors were occurring was limited (Figure 2). Ocean flux differences, greatest in the southern hemisphere mid- and high latitudes, were not detectable by GOSAT because the satellite does not observe far enough south.
These results have both positive and negative implications for carbon cycle research. The good news is that comparisons between model simulations and atmospheric CO2 observations show that land and ocean flux estimates are fairly realistic. The bad news is that large differences still exist in model-based flux estimates, even with lots of satellite data keeping them on track, and many of these differences are not large enough to be observable by current CO2 observing systems. In the future, more work is needed to expand the availability of both ground-based and satellite data, particularly in high latitude regions that are changing most rapidly due to climate.
Reference:
Ott, L., S. Pawson, J. Collatz, W. Gregg, D. Menemenlis, H. Brix, C. Rousseaux, K. Bowman, J. Liu, A. Eldering, M. Gunson, and S. R. Kawa, 2014. Quantifying the observability of CO2 flux uncertainty in atmospheric CO2 records using products from NASA's carbon monitoring flux pilot project. J. Geophys. Res. - Atmos (submitted).