
Sierra Nevada snowpack deficit in winter 2015 depicted by a Landsat-era Reanalysis
In the Sierra Nevada, snowmelt accounts for over 70% of the total streamflow. The accumulated snow in the Sierra Nevada acts as a ‘virtual’ seasonal reservoir that provides the primary water supply for urban and agricultural users. California is currently experiencing a record-setting multiyear drought that started in 2012 which has significantly impacted all aspects of water resources, including snowpack. The ongoing drought has led to acute water shortages, groundwater overdraft, critically low streamflow, and enhanced wildfire risk.
To date, snow in-situ network samples less than 1% of the snow dominated area, therefore making it impossible to accurately and comprehensively understand spatial and temporal characteristics of this precious water resource. This work presents a newly developed state-of-the-art snow water equivalent (SWE) reanalysis dataset over the Sierra Nevada (USA) based on the assimilation of remotely sensed fractional snow cover area data over the Landsat 5-8 data record. The reanalysis dataset is UNIQUE in terms of its large spatial/temporal extent [i.e. it is spatially/temporally continuously cover the entire Sierra Nevada mountainous range, high spatial/temporal resolution, and accuracy]. The reanalysis dataset is herein used to characterize SWE climatology, especially in the context of the recent multiyear drought that started in 2012.
Reanalysis Attributes
- Coverage: 20 snow-dominated basins (~49,000 km2)
- Resolution: 90-meter / daily
- Temporal extent: Landsat 5-8 record, i.e. 1985-2015
Basic Science Questions Answered Using the Reanalysis Dataset
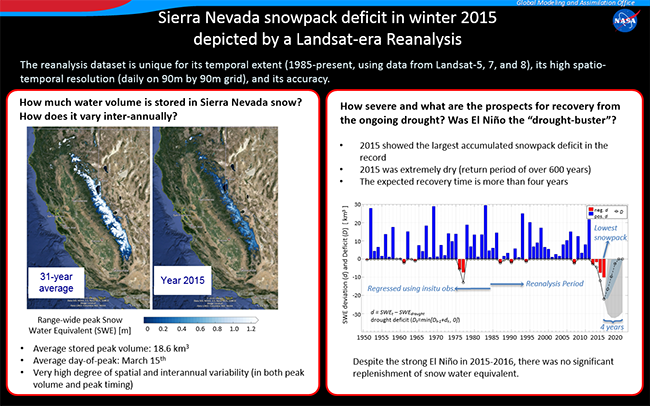
1. How much water volume is stored in Sierra Nevada snow? When does it typically peak? How does it vary inter-annually?
The Figure on the left red box illustrates maps of SWE [in meters] on day of range-wide peak SWE corresponding to the 31-year climatology, and for the winter year 2015. The average stored peak volume was found to be 18.6 km3.
The average day-of-peak was found to be March 15th (note: this indicates that April 1st, often assumed as the peak day by the water resource community, may not be representative of peak conditions).
A very high degree of spatial and interannual variability was found on both peak volume and peak timing.
2. How severe is the recent drought in the context of snowpack? What are the prospects for recovery from the drought? Was El Niño the "drought-buster" the media predicted?
The time series shown in the Figure on the right, shows annual peak SWE deviations (d = SWEt – SWEdrought) and cumulative drought deficit (Dt=min[Dt-1+dt , 0]). Here the SWE reanalysis was further extended back in time using regression with in situ data. SWEdrought is a specified threshold defining drought conditions in a given year, thus ‘d’ is used to define the a ‘drought year’, while ‘D’ is used to classify the drought period and provides a basis for quantifying the response time scale of the drought.
The ongoing California drought has resulted in the lowest snowpack years (years 2014 and 2015) and three of the four driest years over the reanalysis record. A statistical analysis of the time series allowed to characterize year 2015 has ‘extreme (dry) year’, with range-wide peak snow volume characterized by a return period of over 600 years.
In the same Figure, the projected ensemble median using Monte-Carlo simulation is shown by the black dashed line (while the dark grey and light grey bands represent the inter-quartile and 1st-99th percentile ranges respectively). Statistically speaking, the expected value of the drought recovery time was found to be over 4 years.
Finally, the winter 2015-2016 showed a very strong El Niño (i.e. as indicated by the Multivariate ENSO Index [MEI]). Despite the significant speculation about the potential El Niño-driven drought buster, the impact of El Niño on water year 2016 SWE appears to have led to a near-normal snow year. This is not surprising given MEI was found to have a weak relationship with peak SWE.
References
Margulis, S. A., G. Cortés, M. Girotto, et al. 2016. Characterizing the Extreme 2015 Snowpack Deficit in the Sierra Nevada (USA) Range and the Implications for Drought Recovery. Geophysical Research Letters, (In Press), DOI: 10.1002/ 2016GL068520.
Margulis, S. A., G. Cortés, M. Girotto, and M. Durand. 2016. A Landsat-era Sierra Nevada (USA) Snow Reanalysis (1985-2015). Journal of Hydrometeorology, (In Press), DOI: 10.1175/JHM-D-15-0177.1.
Margulis, S. A., M. Girotto, G. Cortés, and M. Durand. 2015. A Particle Batch Smoother Approach to Snow Water Equivalent Estimation. Journal of Hydrometeorology, 16 (4): 1752–1772, http://dx.doi.org/10.1175/JHM-D-14-0177.1.
Girotto, M., G. Cortés, S. A. Margulis, and M. Durand. 2014. Examining spatial and temporal variability in snow water equivalent using a 27 year reanalysis: Kern River watershed, Sierra Nevada. Water Resources Research, 50 (8): 6713–6734, DOI: 10.1002/2014WR015346.
Cortés, G., M. Girotto, and S. A. Margulis. 2014. Analysis of sub-pixel snow and ice extent over the extratropical Andes using spectral unmixing of historical Landsat imagery. Remote Sensing of Environment, 141: 64–78, DOI: 10.1016/j.rse.2013.10.023.
Girotto, M., S. A. Margulis, and M. Durand. 2014. Probabilistic SWE reanalysis as a generalization of deterministic SWE reconstruction techniques. Hydrological Processes, 28 (12): 3875–3895, DOI: 10.1002/hyp.9887.