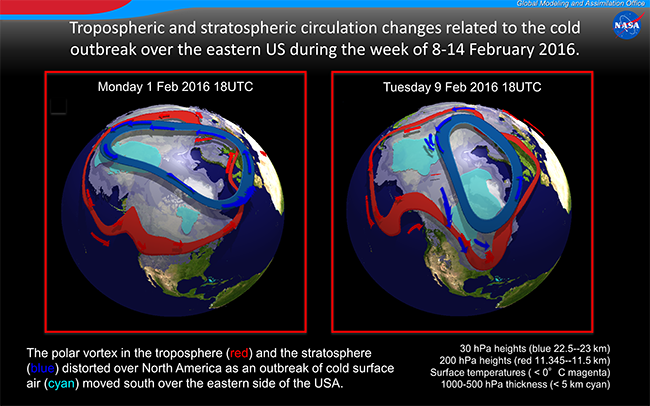
Tropospheric and stratospheric circulation changes related to the cold outbreak over the eastern US during the week of 8-14 February 2016
During the week of 8-14 February 2016, cold air swept down across the eastern half of the US. During this event the tropospheric jet stream also moved down across the southern US (an upper tropospheric trough). Associated with these tropospheric changes, the stratospheric polar vortex also changed dramatically from initially being located over the Asian continent to moving over the US upper tropospheric trough. The relocation of the stratospheric polar vortex created strong stratospheric flow from over the North Pole directly to the US. These major changes in the atmospheric circulation were captured in the NASA GMAO 10-day global forecast system.

2) 200 hPa geopotential height are colored red between 11.345 and 11.5 km.
3) near-surface (two-meter) temperature: values less than 0°C are shown as shaded magenta colors.
4) 1000-500 hPa geopotential height thickness: colored cyan when less than 5 km.
The animation shows the the time series of the GEOS-5 analyses, illustrating the dynamic nature of the flow and the evolving deep structure of the polar vortex from the cold air at the surface to the distorted flow in the stratosphere. The animation and figures show the stratospheric polar vortex (thick blue curve) and upper tropospheric jet stream (thick red curve) with corresponding blue and red trajectories to illustrate the sense of the flow. Ground temperatures less than freezing are shaded magenta and the cyan regions denote cold lower tropospheric temperatures. The main trough formed near the end of 8 February. This event provides an excellent example of the coupling often seen between the troposphere and the stratosphere, even though the stratospheric vortex remains strong and returns to a more zonal configuration after this disturbance.
A larger version of this animation is available for download. Links: MPEG-4 format, OGG format

