

The 2024 Sudden Stratospheric Warming in GEOS Systems
This science snapshot illustrates the ability of the GMAO’s numerical weather prediction systems to forecast key aspects of large disturbances of the polar stratosphere at least two weeks in advance.
The stratospheric polar vortex (hereafter, polar vortex) is a large-scale circumpolar westerly (i.e., eastward) circulation pattern, which exists between autumn and spring in each hemisphere. It extends throughout the depth of the polar stratosphere and into the mesosphere. Sudden stratospheric warmings (SSWs) are dramatic disruptions of this circulation. During an SSW, the polar vortex can become displaced, deformed, sometimes split, or even all but annihilated at certain altitudes. This occurs due to strong easterly momentum fluxes supplied by planetary-scale waves originating in the troposphere and propagating upwards. SSWs owe their name to rapid increases of polar stratospheric temperature caused by compression heating from accelerated descent of air associated with these events. On average SSWs occur once every 2-3 years in the northern hemisphere. Their complex, nonlinear nature puts atmospheric circulation models to the test. Since SSWs often impact surface weather through stratosphere-troposphere coupling, their faithful representation in numerical weather prediction models contributes to forecast skills on medium to subseasonal range time scales.
Two consecutive warming events occurred in the northern polar stratosphere in early and mid-January 2024. We can track the evolution of these disturbances using the output of the GMAO’s GEOS Forward Processing (GEOS-FP) system. The initial wave pulse led to a temperature increase of about 40 K in the middle stratosphere over the North Pole and displaced the polar vortex off the pole towards the North Atlantic (Figure 1, left panel). The second and weaker pulse deformed the vortex further and split the middle and lower portion of it into two unequal vortices (Figure 1, right panel). This led to a brief reversal of the zonal mean zonal wind at 10-hPa (30 km) from westerly to easterly (not shown), thus meeting the formal criterion for a major SSW.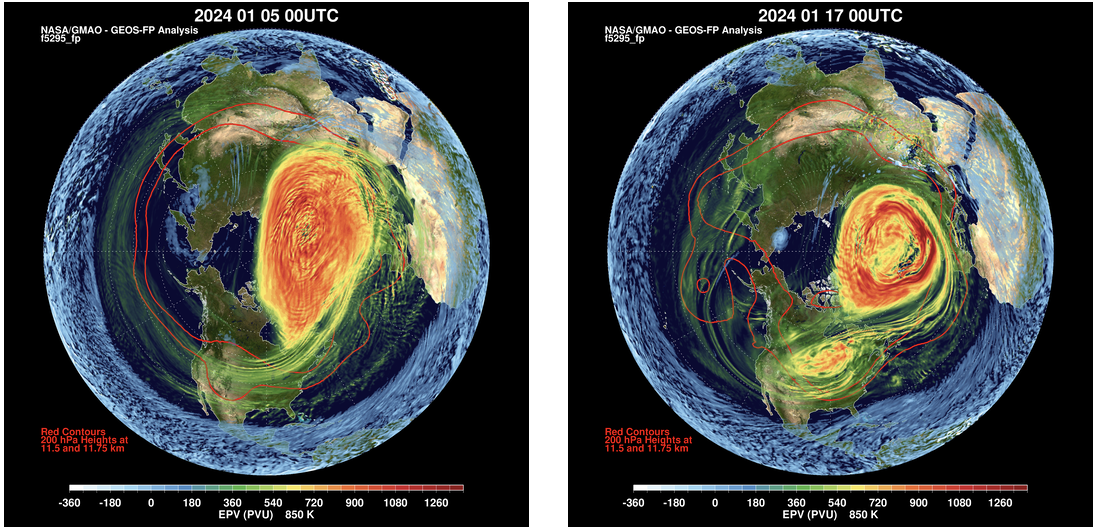
How well was this extended event forecast by the GEOS systems? Figure 2 shows 10-hPa (approximately 30 km above the surface) North Pole temperature forecasts at different lead times. These simulations are from GMAO’s subseasonal-to-seasonal prediction system (S2S) initialized every five days and ran for 45 days. All four ensemble members are shown.
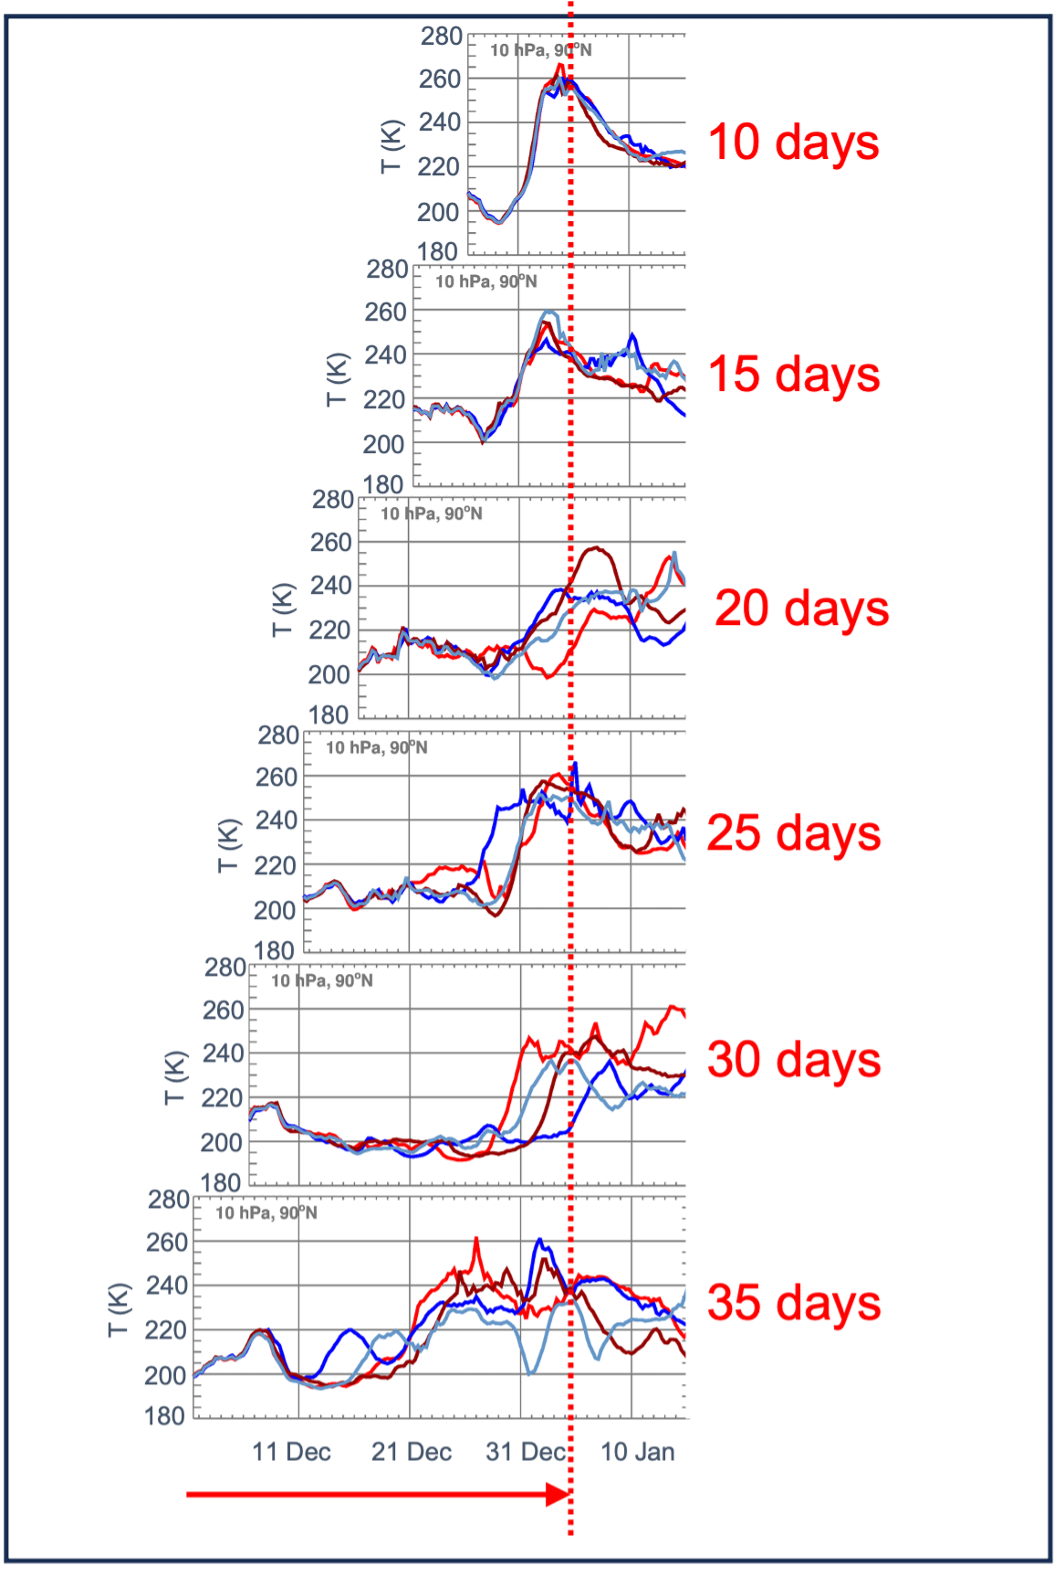
At a 35-day lead time all ensemble members suggest increase in wave activity in late December, although this is consistent with climatological evolution of polar stratospheric temperatures. The 30-day forecasts show a more rapid warming; however, its timing is uncertain at this lead time as indicated by the large spread among the ensemble members. The forecasts begin to converge at 25 and 20-day lead times. At 15 and 10 days all four ensemble members agree on the magnitude and timing of the warming.
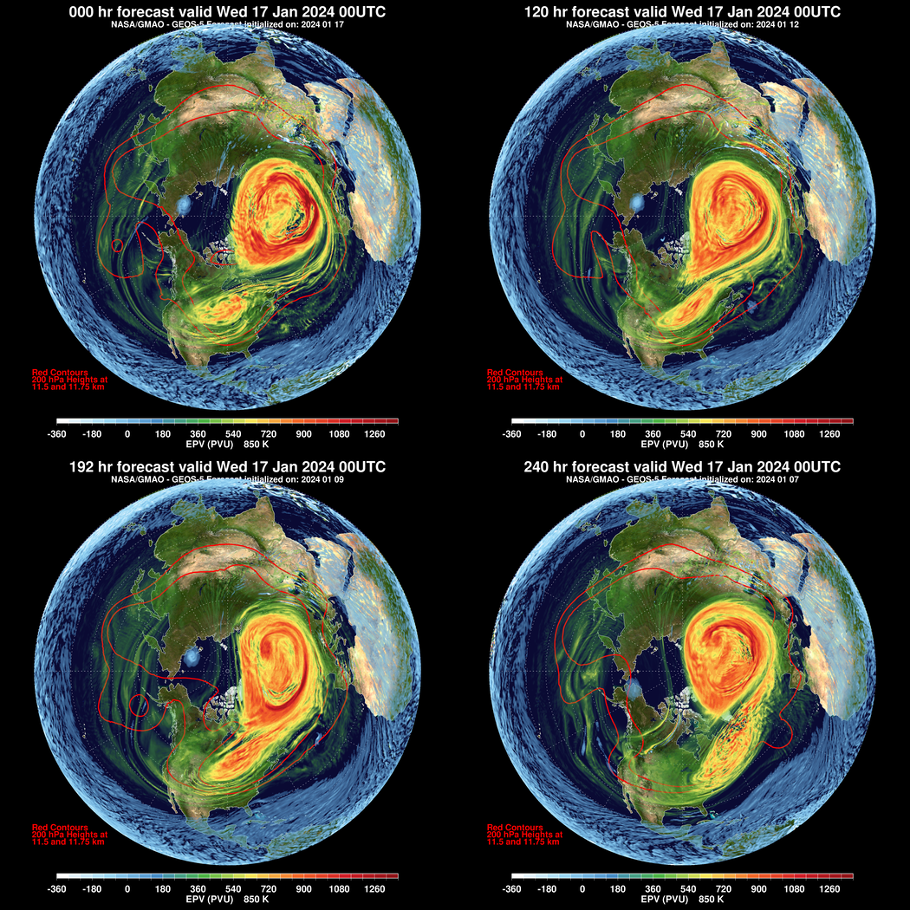
Figure 3 demonstrates the ability of GEOS-FP, GMAO’s medium-range weather prediction system to forecast details of polar stratospheric circulation during the 2024 SSW. The upper left panel, the same as the right panel in Figure 1, shows the morphology of the polar vortex in the middle stratosphere on 17 January alongside geopotential height contours at 200 hPa from the GEOS-FP analysis, which provides the optimal estimate of the state of the atmosphere derived from observations. The other three panels show five-, eight-, and 10-day forecasts verified on the same day. The forecasts realistically reproduce key features of the polar vortex out to 10 days: the vortex position and shape, including its partial split observed at the altitude shown (and below) as well as the positions of troughs and ridges near the tropopause (red contours) associated with the disturbed stratospheric circulation above and cold weather conditions at the surface in North America.
The following animation shows a projection of a three-dimensional representation of the polar vortex from a 10-day GEOS-FP forecast initialized on 14 January 2024. Shown are selected potential vorticity contours colored by altitude range: lower troposphere (purple), upper troposphere (red), lower stratosphere (white), upper stratosphere (cyan), and lower mesosphere (yellow).
References:
Manney, G. L., Butler, A. H., Lawrence, Z. D., Wargan, K., & Santee, M. L. (2022). What's in a name? On the use and significance of the term “polar vortex”. Geophysical Research Letters, 49, e2021GL097617. https://doi.org/10.1029/2021GL097617