

MJO Propagation and Associated Moist Dynamics in Version 3 of GEOS-S2S Forecast System
The Madden-Julian Oscillation (MJO) has major impacts on regional precipitation patterns in the tropics as it propagates eastward around the equator. The MJO is also known to impact the development of extratropical weather/climate systems through large-scale teleconnections. This eastward MJO propagation has been significantly better captured in Version 2 of the GEOS subseasonal-to-seasonal (S2S) forecast system (Molod et al. 2020; Lim et al. 2021), compared to an earlier Version 1. Here, we show the MJO propagation reliably represented in the latest version of the GEOS-S2S forecast system, known as the GEOS-S2S Version 3 (GEOS-S2S-3), which is set to replace the current operational Version 2.
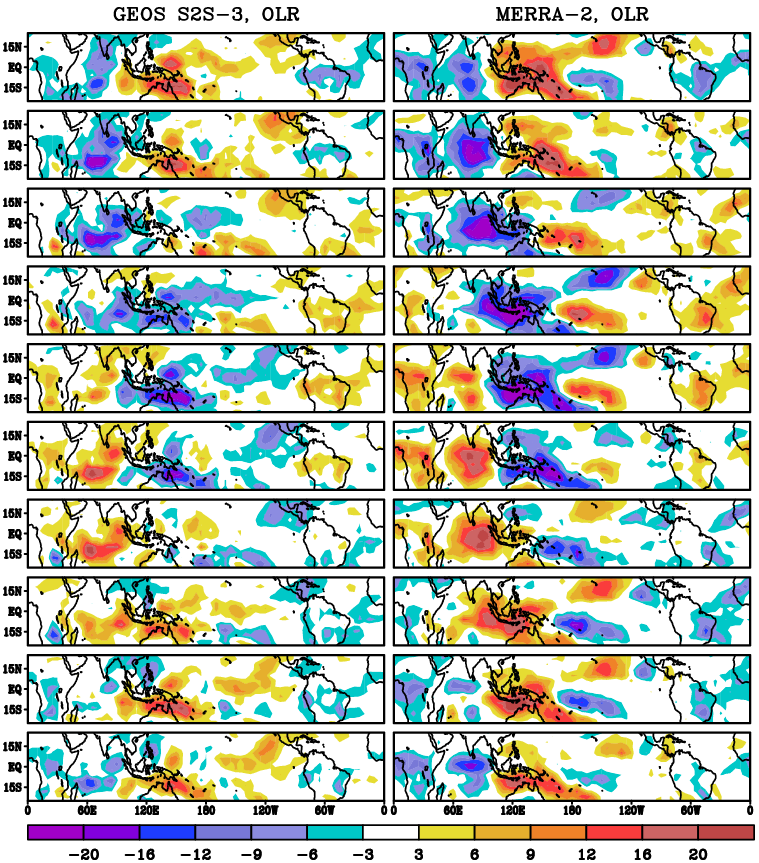
Figure 1 demonstrates that the GEOS-S2S-3 reliably represents the eastward propagation of the MJO convection along the equatorial region. It takes about ~45 days for the propagating MJO to complete one round along the equator. Approximately 45 days corresponds to ~5m/sec, which is widely accepted as the observed average speed of MJO.
It is generally accepted based on the moisture mode theory that the positive moist static energy (MSE) tendency to the east of the MJO convective anomaly associated with the premoistening process facilitates eastward MJO propagation (e.g., Kiranmayi & Maloney, 2011; Anderson & Kuang, 2012; Arnold et al., 2015). Thus, we investigate the MSE tendency to address how well this moistening process is realized in GEOS-S2S. MSE (m) is defined as m=cp T+gZ+Lv q , where cp is the specific heat of dry air at constant pressure, T is temperature, g is gravity, z is geopotential height, Lv is the latent heat energy of vaporization, and q is specific humidity. The vertically integrated MSE tendency is

where angle brackets denote a pressure-weighted vertical integral

The MSE tendency is controlled by advection, longwave (LW) and shortwave (SW) radiative heating, surface latent heat flux (LH), and sensible heat flux (SH), and for MERRA-2 only, the vertically integrated analysis increment of MSE. This analysis increment (analysis MSE tendency) is added to the model’s state variables at each time step and is therefore part of the reanalysis budget. Comparison of the individual terms on the right-hand side identifies that this analysis increment of MSE is small in relation to the advection and surface flux tendency terms, and does not affect much the MSE budget.
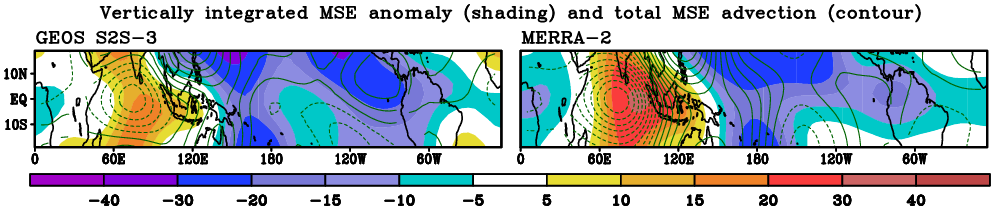
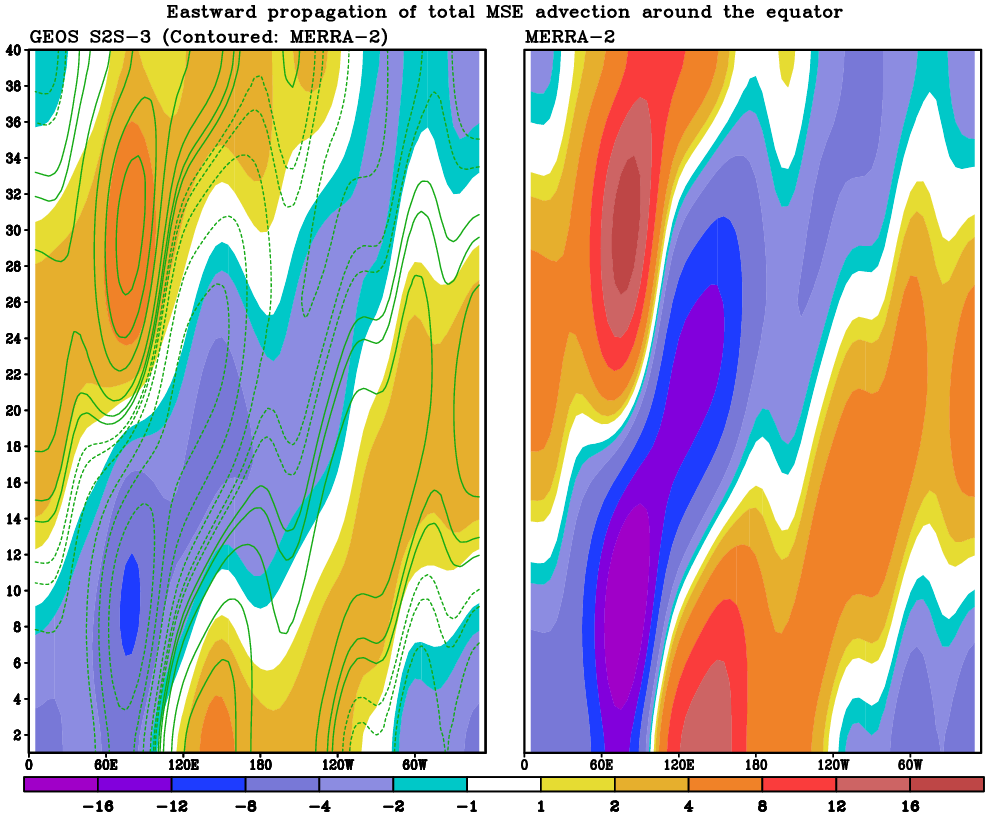
Our investigation found that the positive MSE advection makes a significant contribution to the MSE growth (positive MSE tendency). Figure 2 shows the distribution of the vertically integrated total advection of MSE advection (contoured) when the MJO convection represented by positive MSE anomaly (shaded) approaches the Maritime Continent (MC) from the west. We find positive MSE advection anomaly over the region east of the MC for both GEOS-S2S-3 (left) and MERRA-2 (right), indicating the growth of MSE there to develop the new convection for eastward MJO propagation. Time evolution of total MSE advection in Figure 3 demonstrates that the MSE advection propagates eastward around the equator with MJO time scale. This time evolution shows generally a good agreement between GEOS-S2S-3 and MERRA-2.
In summary, the results indicate that the premoistening process to the east of MJO convection is represented reliably in the GEOS-S2S-3 system, facilitating the eastward propagation of the MJO.
References:
Anderson, J. A., and Z. Kuang, 2012: Moist static energy budget of MJO-like disturbances in the atmosphere of a zonally symmetric aquaplanet. J. Climate, 25, 2782-2804, https://doi.org/10.1175/JCLI-D-11-00168.1.
Arnold, N. P., M. Branson, Z. Kuang, D. A. Randall, and E. Tziperman, 2015: MJO intensification with warming in the superparameterized CESM. J. Climate, 28, 2706-2724, https://doi.org/10.1175/JCLI-D-14-00494.1.
Kiranmayi, L., and E. Maloney, 2011: Intraseasonal moist static energy budget in reanalysis data. J. Geophys. Res. – Atmospheres, 116, D21117, https://doi.org/10.1029/2011JD016031.
Lim, Y.-K., N. P. Arnold, A. M. Molod, and S. Pawson, 2021: Seasonality in prediction skill of the Madden-Julian Oscillation and associated dynamics in Version 2 of NASA’s GEOS-S2S forecast system. J. Geophys. Res. - Atmospheres., 126(18), e2021JD034961, doi:10.1029/2021JD034961.
Molod, A. M., E. Hackert, Y. Vikhliaev, B. Zhao, D. Barahona, G. Vernieres, A. Borovikov, R. Kovach, J. Marshak, S. Schubert, Z. Li, Y.-K. Lim, L. Andrew, R. Cullather, R. Koster, D. Achuthavarier, J. Carton, L. Coy, J. Friere, K. M. Longo, K. Nakada, and S. Pawson, 2020: GEOS-S2S Version 2: The GMAO high resolution coupled model and assimilation system for seasonal prediction. J. Geophys. Res. – Atmospheres, 125(5), e2019JD031767, doi:10.1029/2019JD031767.