

Exceptional Wildfire Smoke Across Canada Inundates the Northeastern United States
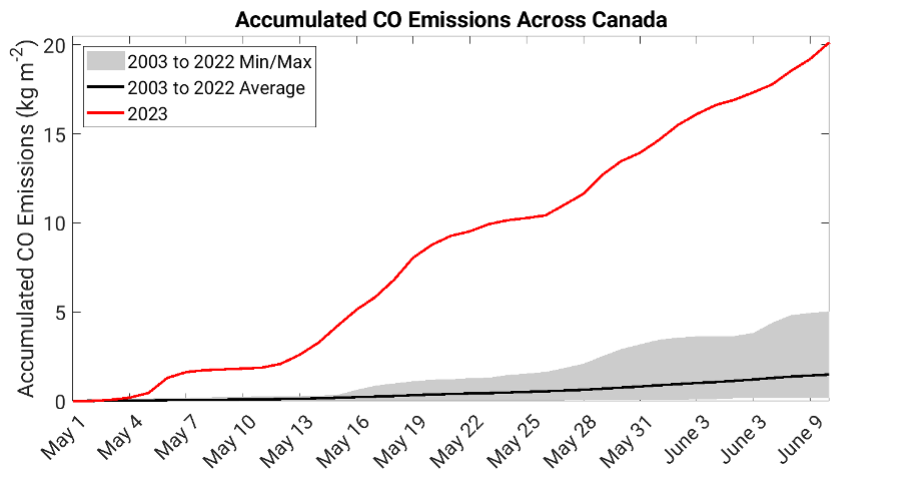
Warm and dry conditions throughout boreal Canada in early spring of 2023 led to enhanced fire weather conditions and an early start to the biomass burning season. On May 5, 2023, a cluster of wildfires ignited in Alberta, Canada and began an onset of accumulated emissions of carbonaceous aerosols and trace gases that have outpaced all Canadian biomass burning seasons since the beginning of the MODIS satellite record in 2003 (Figure 1). Accumulated CO emissions across Canada for 2023 are roughly quadruple the prior maximum from the previous 20 years.
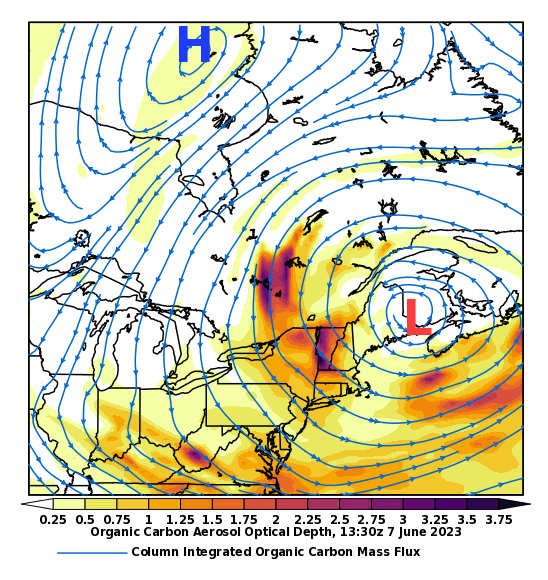
With wildfires continuing in Alberta and western Saskatchewan throughout the entire month of May, anomalous smoke had become widespread across all of Canada. Due to the atmospheric circulation smoke was transported southward into the United States on occasion. The AERONET observed aerosol optical depth (AOD) at 500 nm at Goddard Space Flight Center in Greenbelt, MD, a quantity that is typically on the order of a few tenths, neared 2 on three separate days in May 2023 (https://aeronet.gsfc.nasa.gov/). Over the first couple days in June, wildfires erupted and grew in magnitude on the opposite side of Canada in Quebec. Aged smoke transported from the west became exacerbated by fresh smoke in eastern Canada. An area of high pressure began to build over central Canada by Tuesday, June 6, 2023, and coupled with a low-pressure system located over Maine, smoke was funneled southward into the northeastern United States (Figure 2). The blocking pattern remained in place and resulted in three days of record-breaking levels of particulate matter (PM) near the surface in major cities including New York, Philadelphia, Baltimore, and Washington, DC, before conditions began to improve in the evening hours of June 9, 2023.
https://portal.nccs.nasa.gov/datashare/gmao/geos-fp/.internal/Wildfires/geos-fp.cobbna%2Bqfed.nam.may-jun2023.mp4
Hazy, orange tinted skies and poor air quality ensued throughout the June 6 to June 9 smoke event. By the third day of the event, the public understood the impact of the Canadian wildfires on local air quality due to the remarkable media coverage. However, at the onset, the public was not prepared for needing to wear masks outside, cancelling youth outdoor activities, or postponing games for professional sports teams. The quasi-operational GEOS Forward Processing (FP) model and assimilation system provides forecasts of AOD and particulate matter (PM) and can be used to demonstrate why forecasts of smoke can be challenging due to the truly interdisciplinary aspects of aerosol forecasting. Forecasting wildfire plumes requires knowledge of wildfire emissions, meteorological conditions that influence aerosol transport, optical and microphysical properties of smoke, atmospheric chemistry, as well as levels of fine PM that are harmful enough to warrant alerting the public.
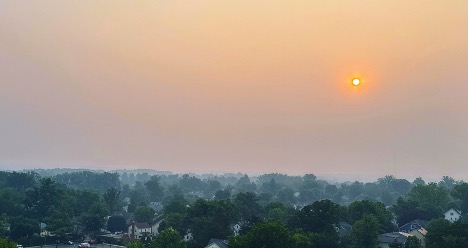
Figure 3a shows AOD over Baltimore as observed by an AERONET station (red points) and as simulated by the GEOS FP analysis (black lines) and up to five-day forecasts, in which shorter forecasts appear as darker dots while longer term forecasts appear fainter. Prior to the wildfire smoke reaching Baltimore, there is good agreement between the AERONET observed AOD and GEOS analyzed and forecasted AOD. However, beginning in the afternoon hours of June 5, 2023, GEOS FP underestimates the observed AOD, despite assimilating AOD from AERONET and MODIS. Most forecasts beginning on June 6 have an AOD much lower than what was observed, perhaps a result of the system only being able to persist fire emissions observed from the day prior to the forecast initialization. This is also evident from the delay in the GEOS FP analysis spiking later than the observations on June 5th and June 6th. A couple longer-term forecasts, initiated on June 4th and 5th, are near the range of the observed AOD on June 7th; however, these forecasts were likely initialized using emissions from the height of the wildfires.
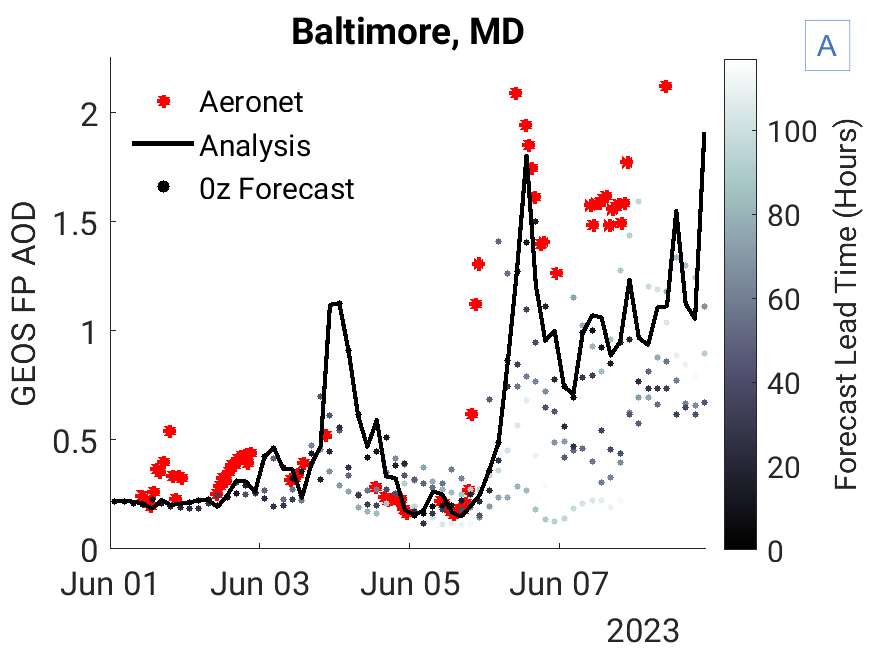
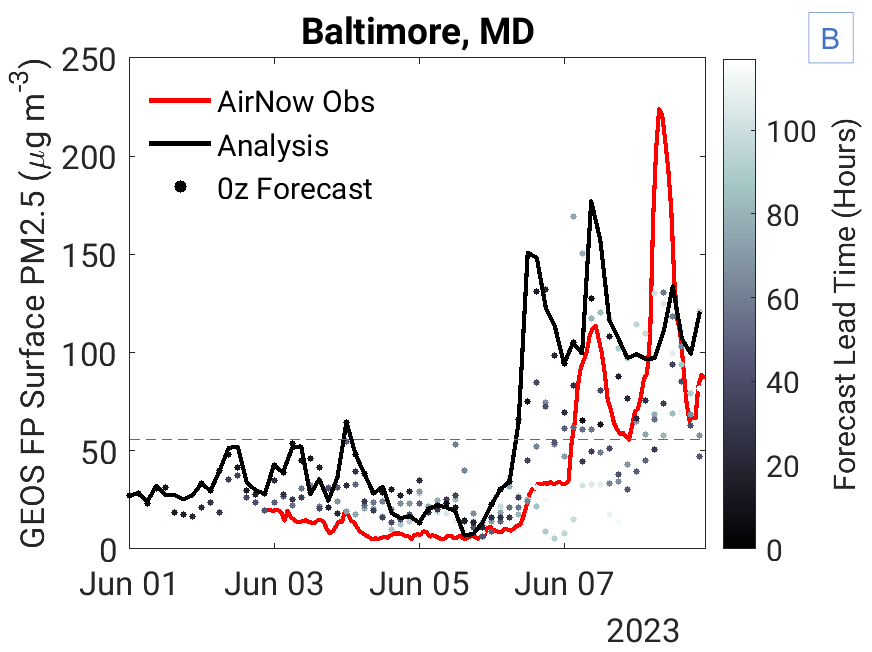
Figure 3b is similar to Figure 2a, except particulate matter with a radius smaller that 2.5 microns (PM2.5) is shown for near surface AirNow observations and at the lowest model level for GEOS FP output. PM2.5 is a regulated pollutant through the Environmental Protection Agency (EPA) since particles that small are capable of penetrating in the lungs and subsequently into the bloodstream and are linked with cardiovascular health issues (Feng et al., 2016). The baseline level of PM2.5 is overestimated in the GEOS FP analysis and forecasts between June 3rd and 5th relative to observations made available through AirNow (https://www.airnow.gov/). Unlike with AOD, the GEOS analysis and short-term forecasts indicate elevated values of PM2.5 arrive in Baltimore earlier than in the observations. Given that AOD, a column integrated quantity, is slightly underestimated during this time, a likely reason for the PM2.5 bias is that the aerosol plume is too low in altitude within the model and/or the mass extinction efficiency is too low. There is a wide range in the forecasted values for PM2.5 but nearly all points remain lower than the analysis. Consistent with this, the final day of the event is marked by an underestimate in surface PM2.5 in both the GEOS FP analysis and forecasts relative to the peak of the AirNow observations. Settling of the aerosol may have occurred too rapidly, causing GEOS to be unable to match record magnitude of PM2.5.
References:
Darmenov, Anton, & da Silva, A. (2015). The Quick Fire Emissions Dataset (QFED): Documentation of versions 2.1, 2.2 and 2.4. NASA/TM–2015–104606, Vol. 38. https://gmao.gsfc.nasa.gov/pubs/docs/Darmenov796.pdf
Feng, S., Gao, D., Liao, F., Zhou, F., & Wang, X. (2016). The health effects of ambient PM2. 5 and potential mechanisms. Ecotoxicology and environmental safety, 128, 67-74, doi: 10.1016/j.ecoenv.2016.01.030.