

A New Minimum in Southern Hemisphere Sea Ice Extent
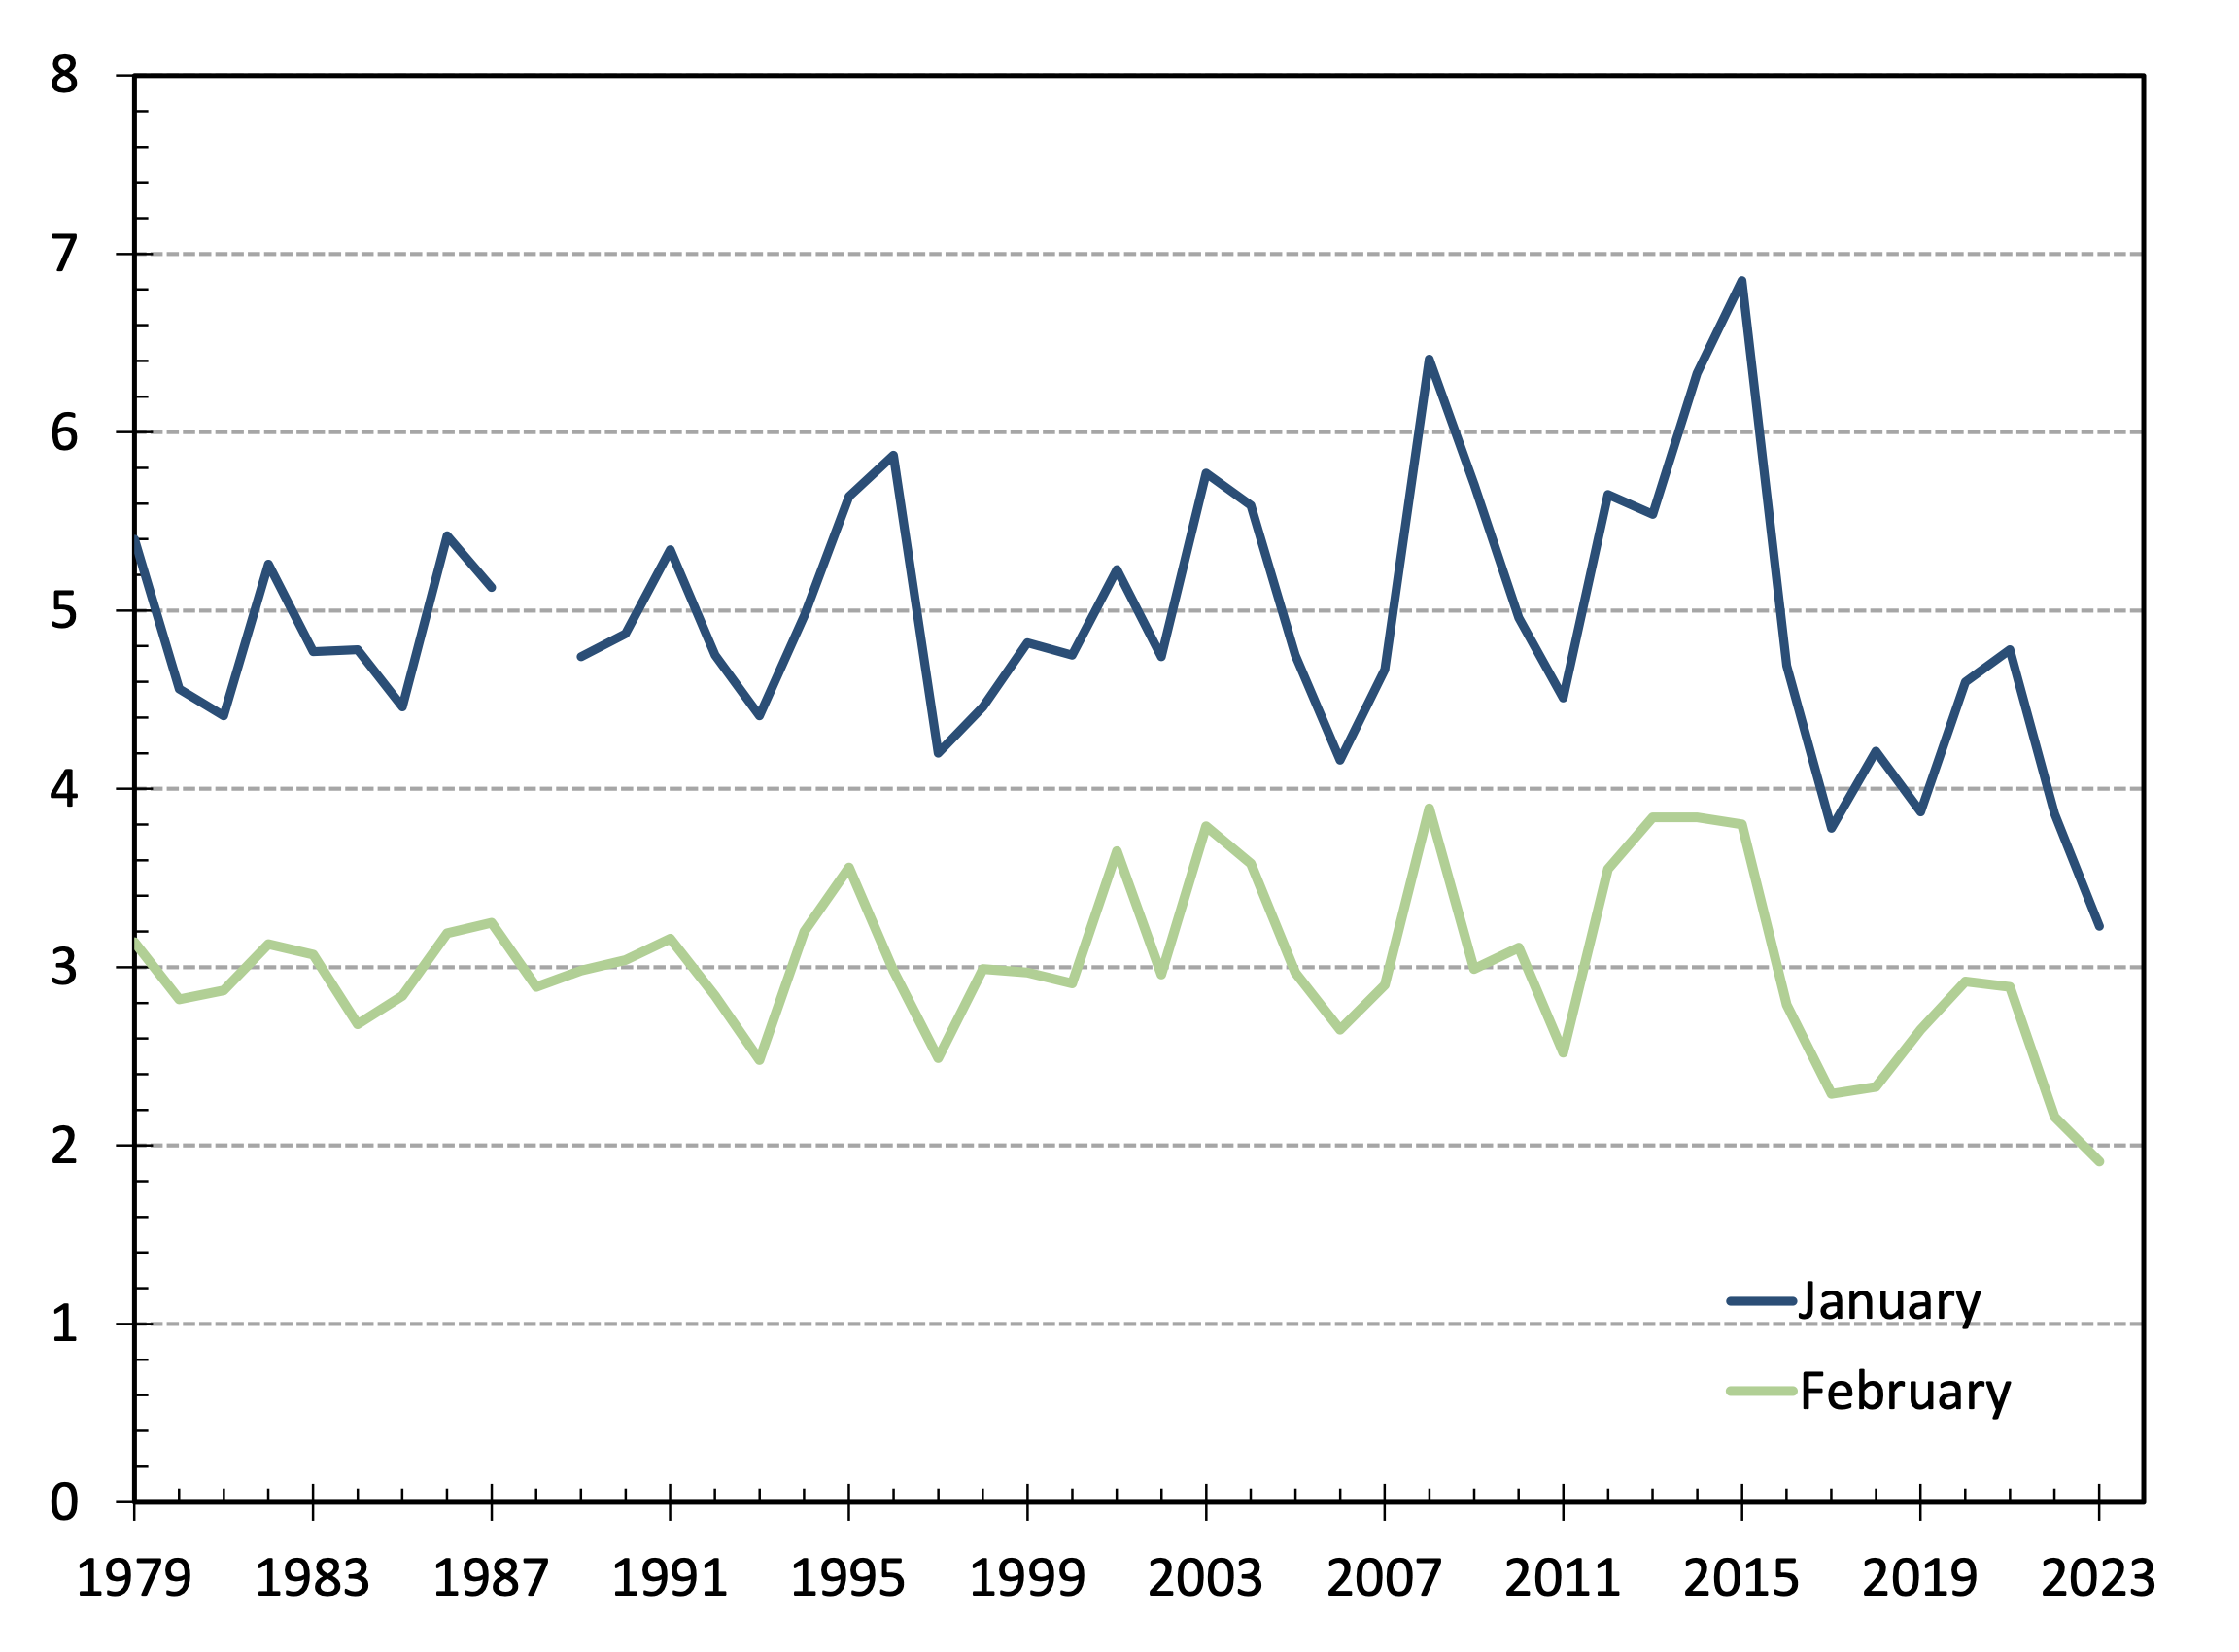
In 2023, the sea ice cover surrounding Antarctica reached its seasonal low on February 19 of just under 1.8 million square km. This value is the lowest in the passive microwave remote sensing era – about 39 percent less than the 1981-2010 average, and eclipsed other recent years of low summertime sea ice cover. After a brief period of increasing extent from 2011 to 2015, sea ice cover in the Southern Hemisphere has trended sharply downward. Ice extent for the austral summer 2023 is about 50 percent less than in 2015 (Fig. 1).
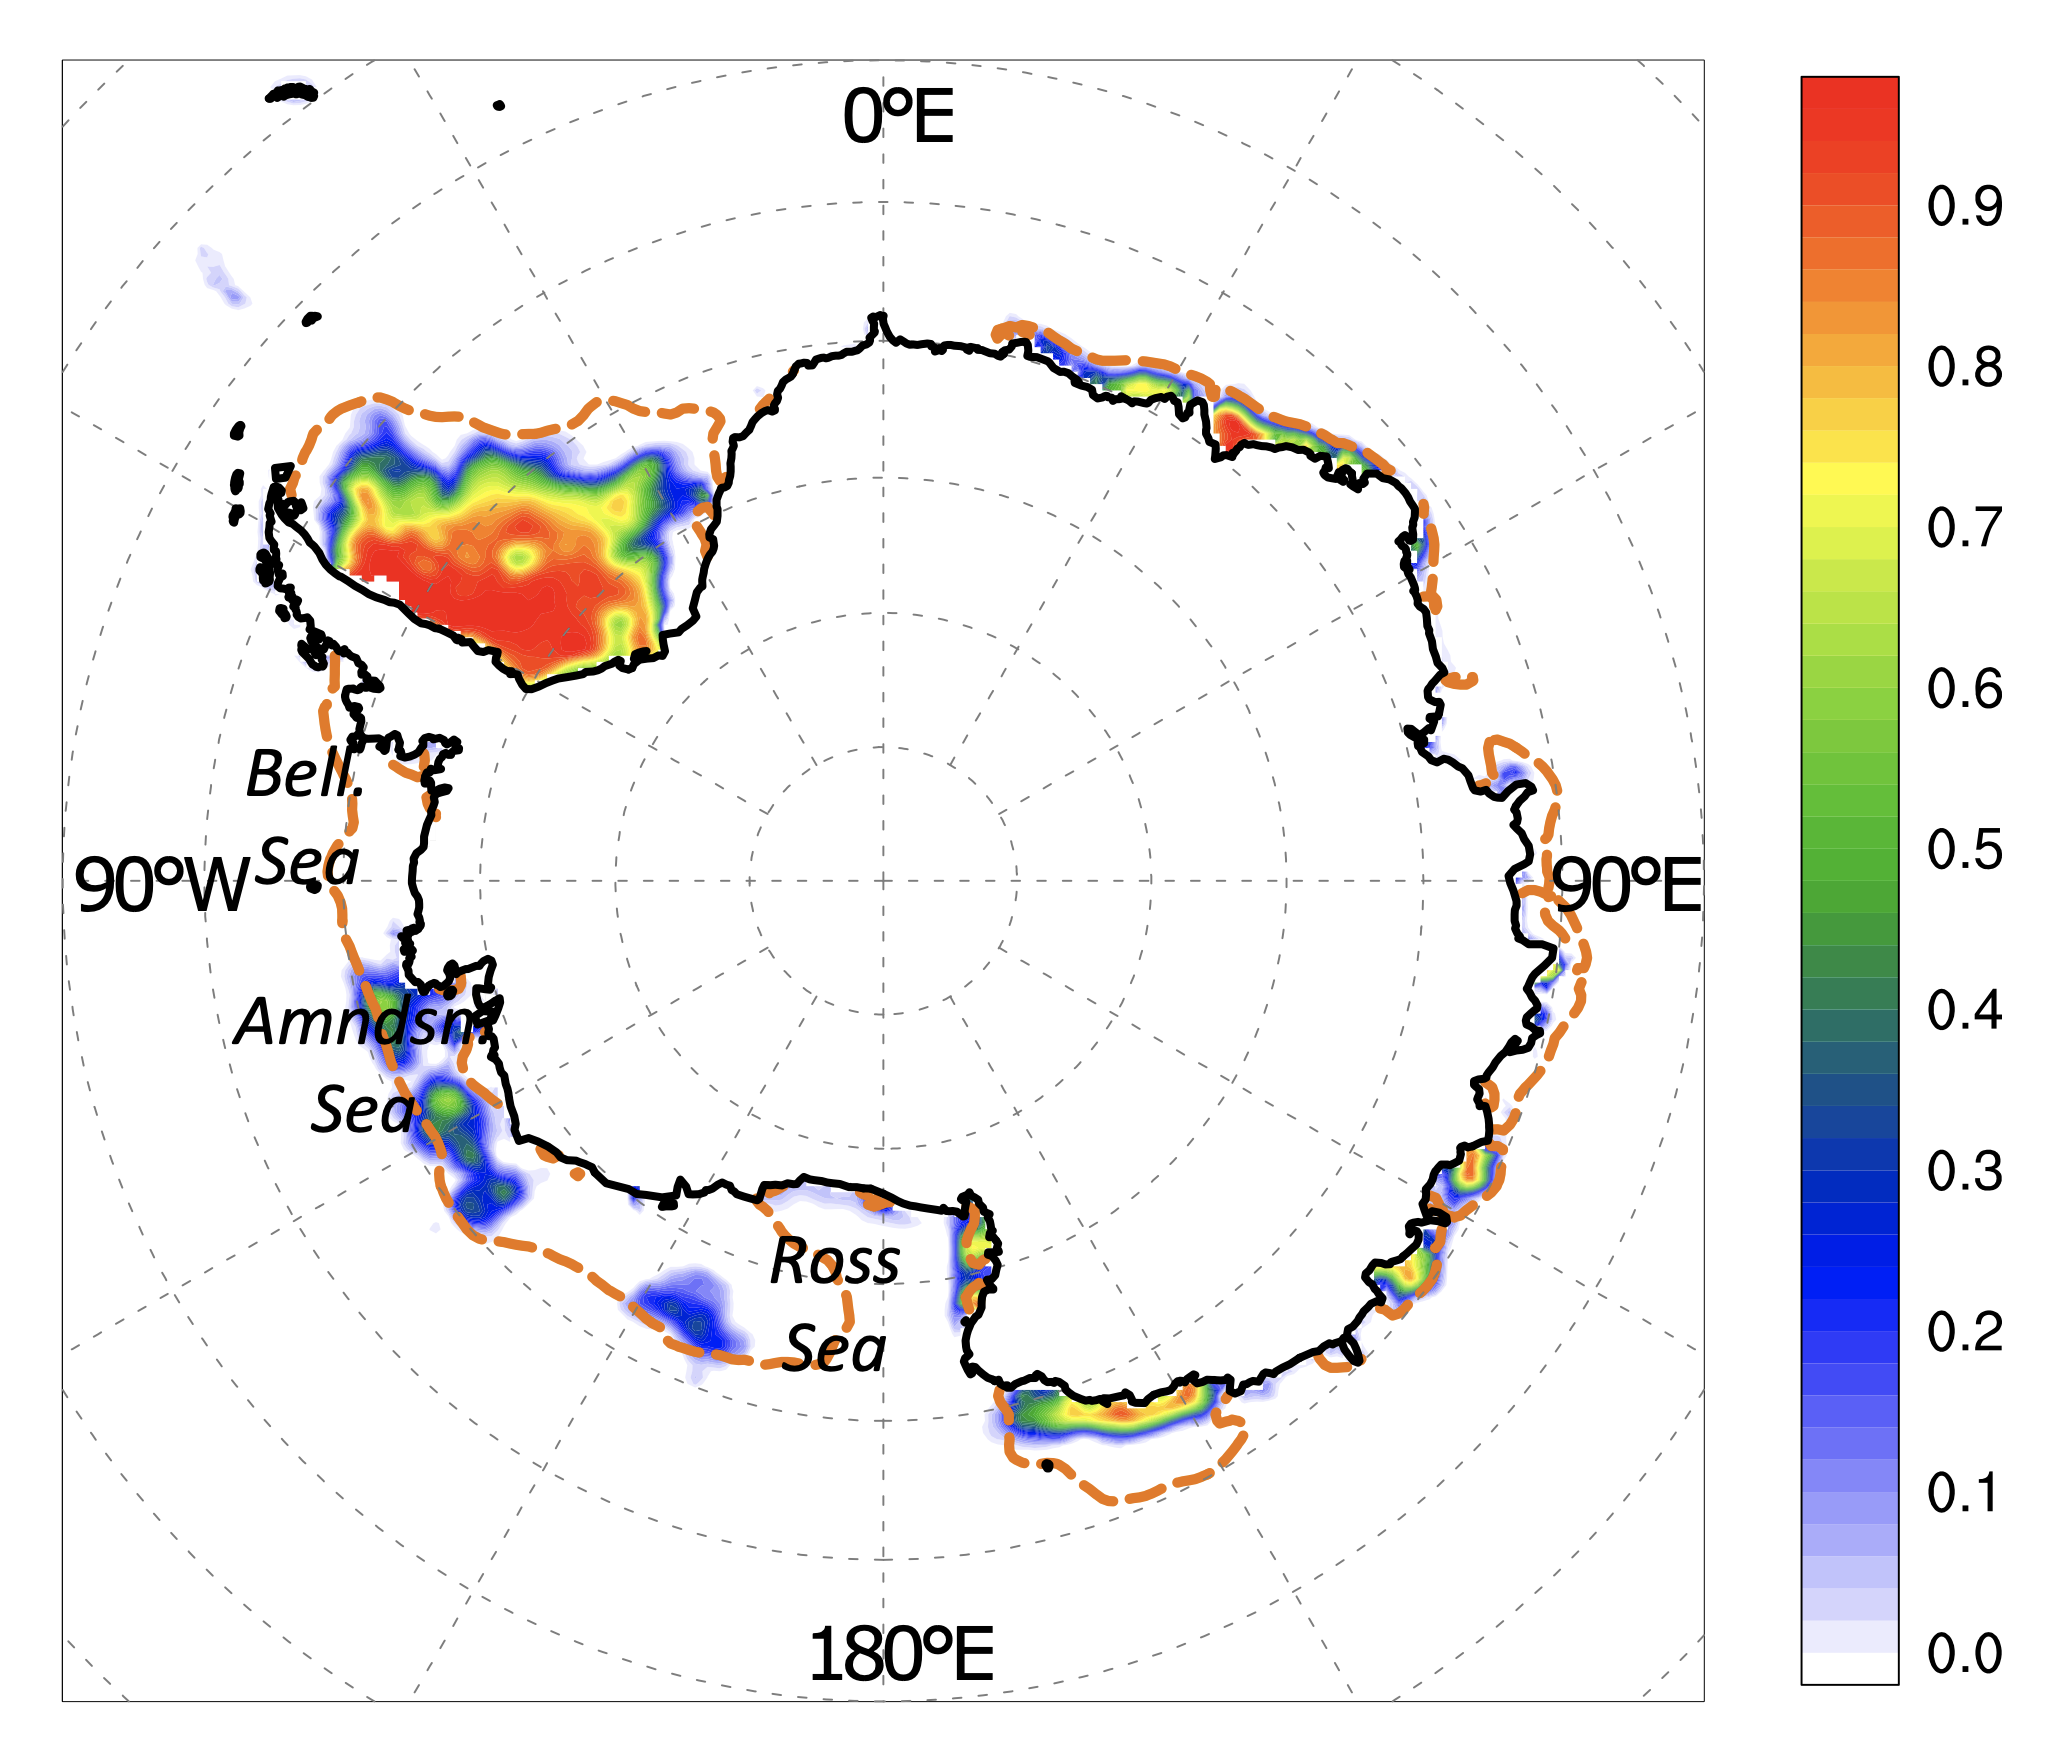
Spatially, the 2023 summer ice extent was less than climatology at nearly all longitudes, but it was particularly reduced in the South Pacific. Sea ice cover was exceptionally low in and around the Ross Sea near 180°E, and it essentially disappeared in the Bellingshausen Sea near 90°W. The seasonality of Antarctic sea ice differs markedly from its Northern Hemisphere counterpart. The bounded Arctic Ocean basin is highly stratified, which limits the ocean heat flux and allows for a sustained, cold surface layer and basal ice growth. In contrast, the Southern Ocean is very turbulent, and sea ice generally grows from the top with snow falling onto the seasonally cooling ocean surface. In spring, solar radiation combines with heat from the ocean to melt most of the Antarctic ice cover. The remaining ice-covered areas are in sheltered embayments and along the continental shelf, where wave action is partially inhibited. It is along the wide continental shelf in the South Pacific – where summer ice cover had prevailed in prior years – that sea ice has been eroded in 2023.
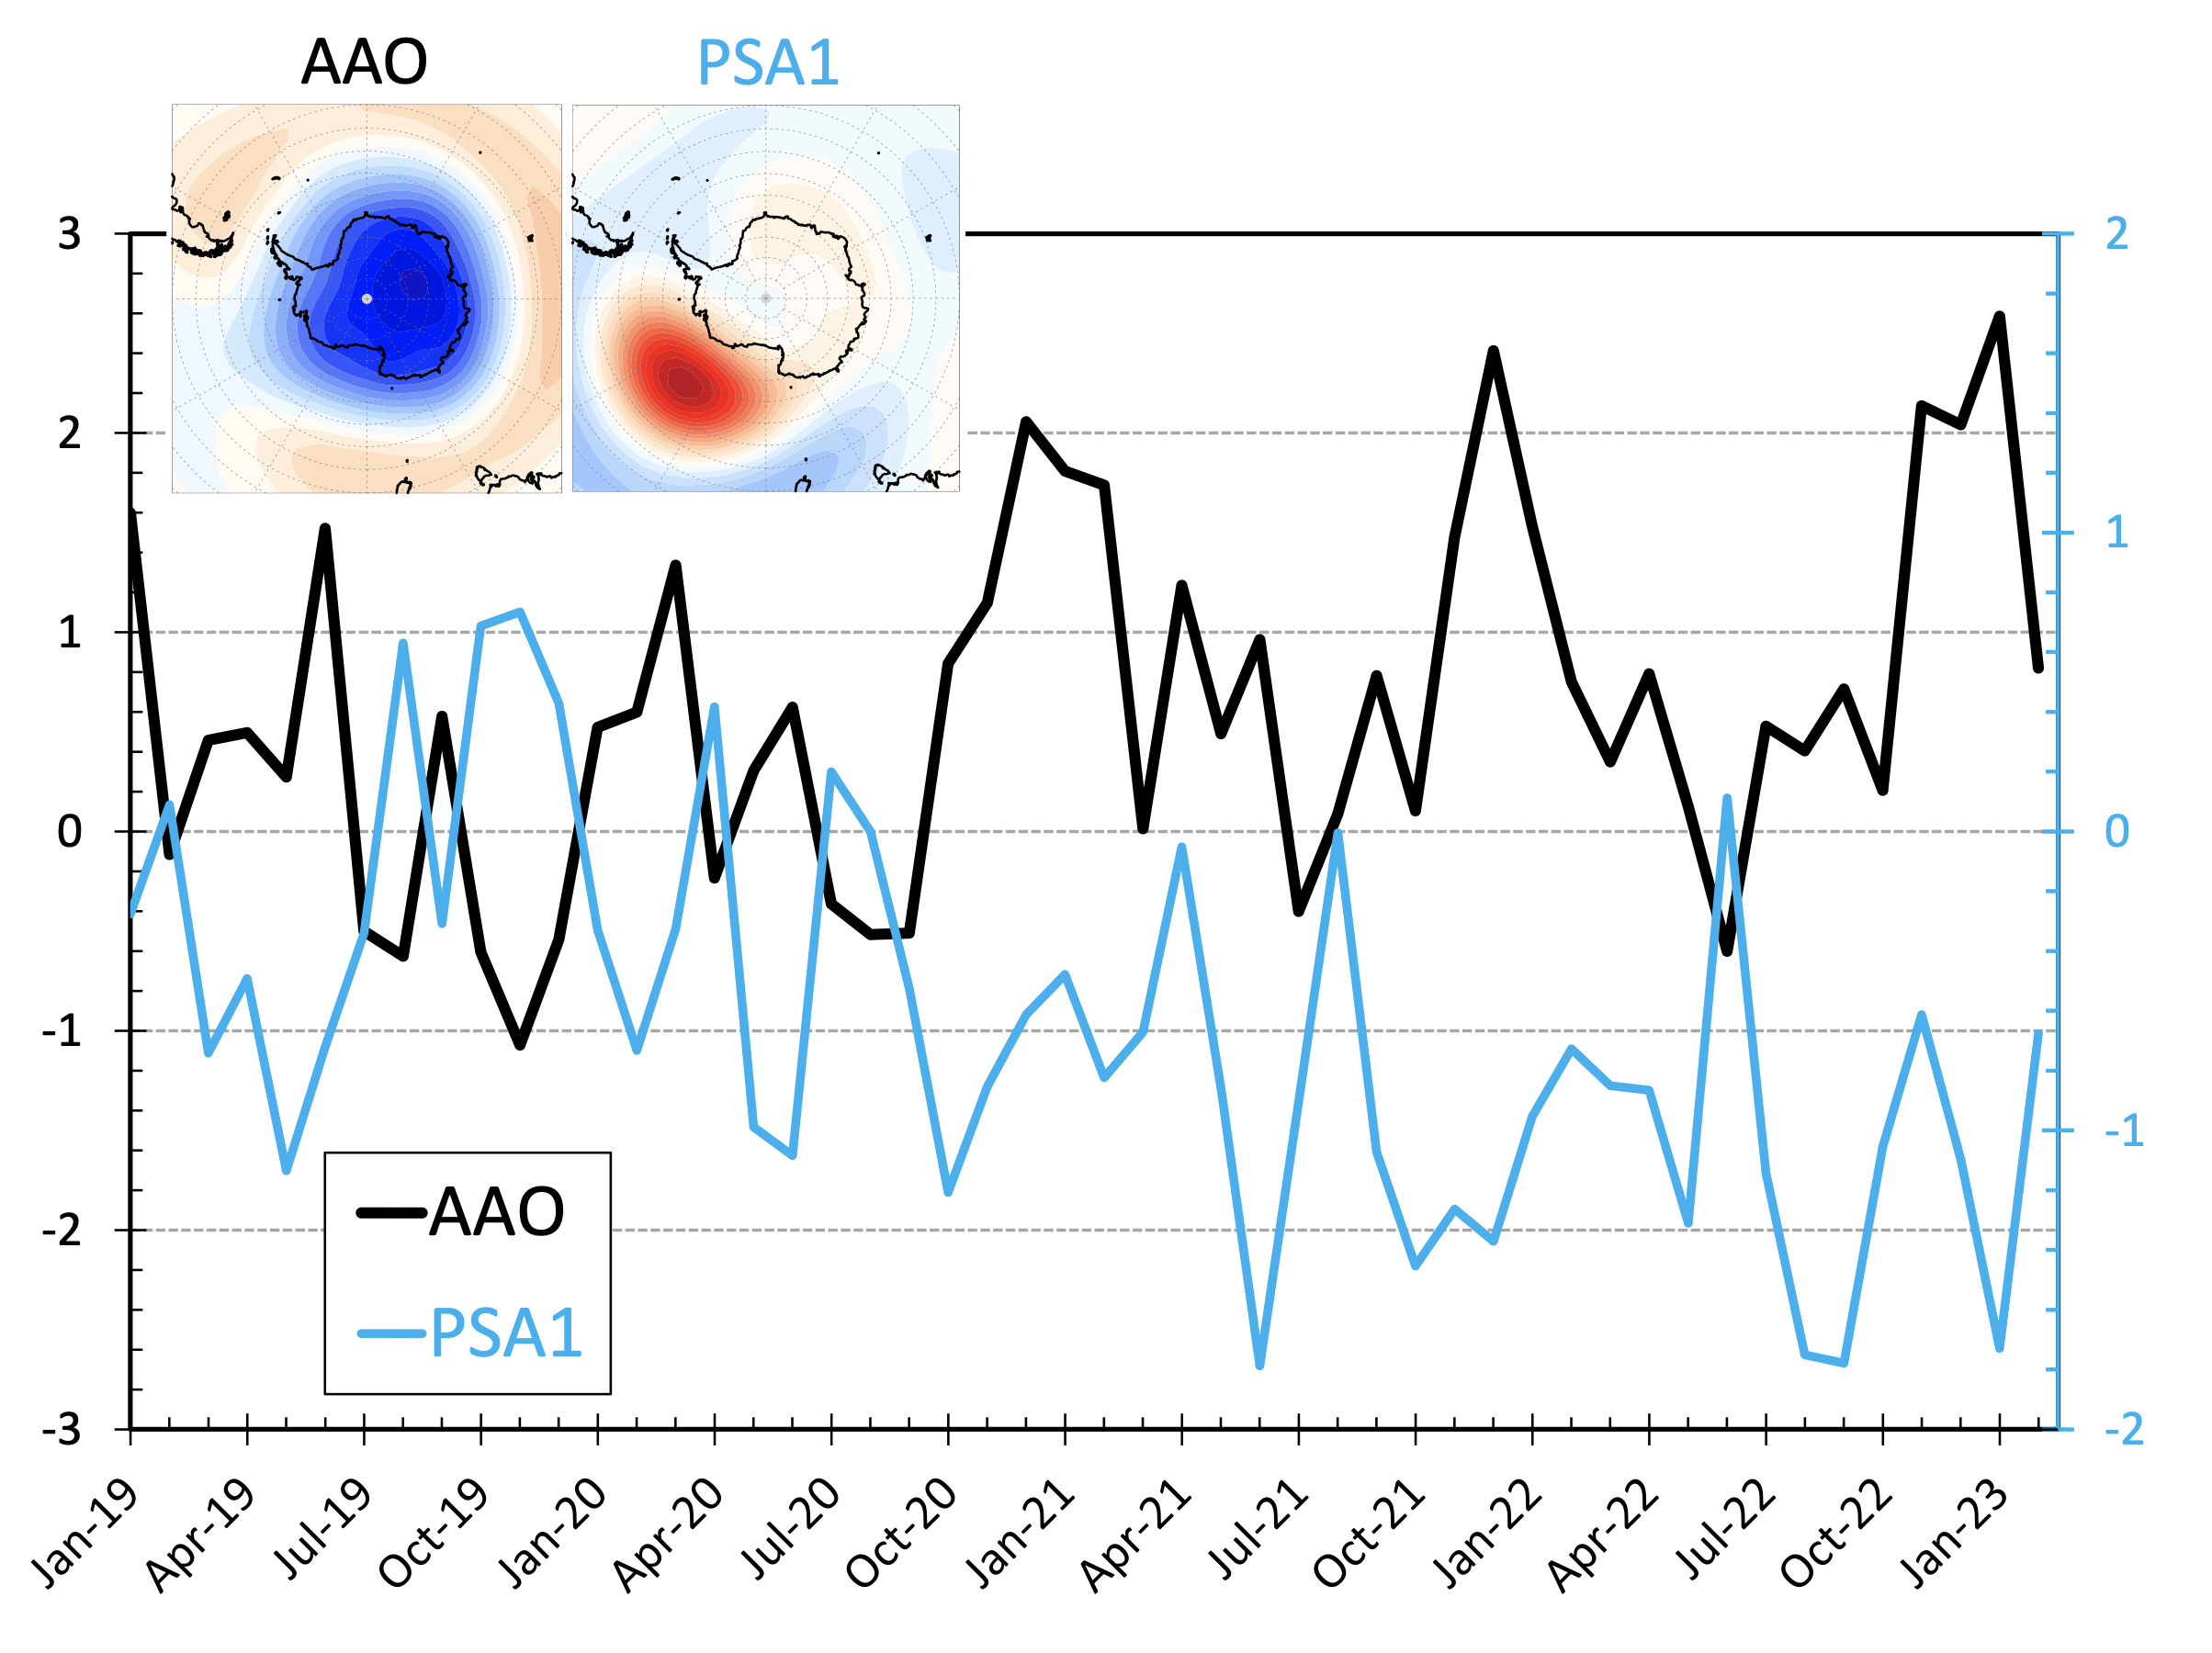
The South Pacific sector of the Southern Ocean is associated with atmospheric teleconnection patterns. The first two modes of variability in the extratropical circulation correspond to the Antarctic Oscillation (AAO) – an approximately zonally-symmetric loading pattern with opposing nodes over the Antarctic continent and at mid-latitudes, and the first Pacific South America mode (PSA1), with oscillatory nodal locations extending poleward in the South Pacific. These two modes present overlapping centers of action in the South Pacific (Fig. 2). As computed from MERRA-2, the AAO index trended positive in the second half of 2022, and reached the second-highest value in the satellite era in January 2023. The sustained high index values for November 2022-January 2023 are the highest in the record. The first Pacific South America mode is associated with the extratropical teleconnection of ENSO. The PSA1 index has been persistently negative over the period of consecutive La Niña events beginning in 2020. The sign convention and large magnitudes of both indices suggest strong anomalous cyclonic circulation over the South Pacific sector. The AAO index also generally suggests low pressure anomalies throughout the southern high latitudes in the austral spring.
Analysis fields from MERRA-2 over the austral spring and summer periods show strong negative sea level pressure anomalies of (minus) 13 to 15 hPa, and centered in the northern Bellingshausen Sea (Fig. 3). The anomaly maps are monthly averages from a series of individual cyclones and anticyclones. On 17-October 2022, a synoptic cyclone in the Bellingshausen Sea reached a central low sea-level pressure near 900 hPa. Storms of such intensity are rare; it exemplifies the exceptional cyclonic conditions in the South Pacific in the 2022-23 austral spring.
Cyclonic circulation provides opposing conditions for sea ice development that are seasonally dependent. In winter, it provides a southward advection of atmospheric moisture and snowfall, which is important for sea ice mass balance in the Southern Hemisphere. The resulting Ekman transport also expands the sea ice field to lower latitudes. As the season turns to spring, the circulation’s poleward heat transport becomes more significant to sea ice conditions, resulting in melt. With warmer conditions and reduced snowfall, the Ekman drift effectively transports the remaining sea ice cover northward, off of the continental shelf and towards warmer waters.
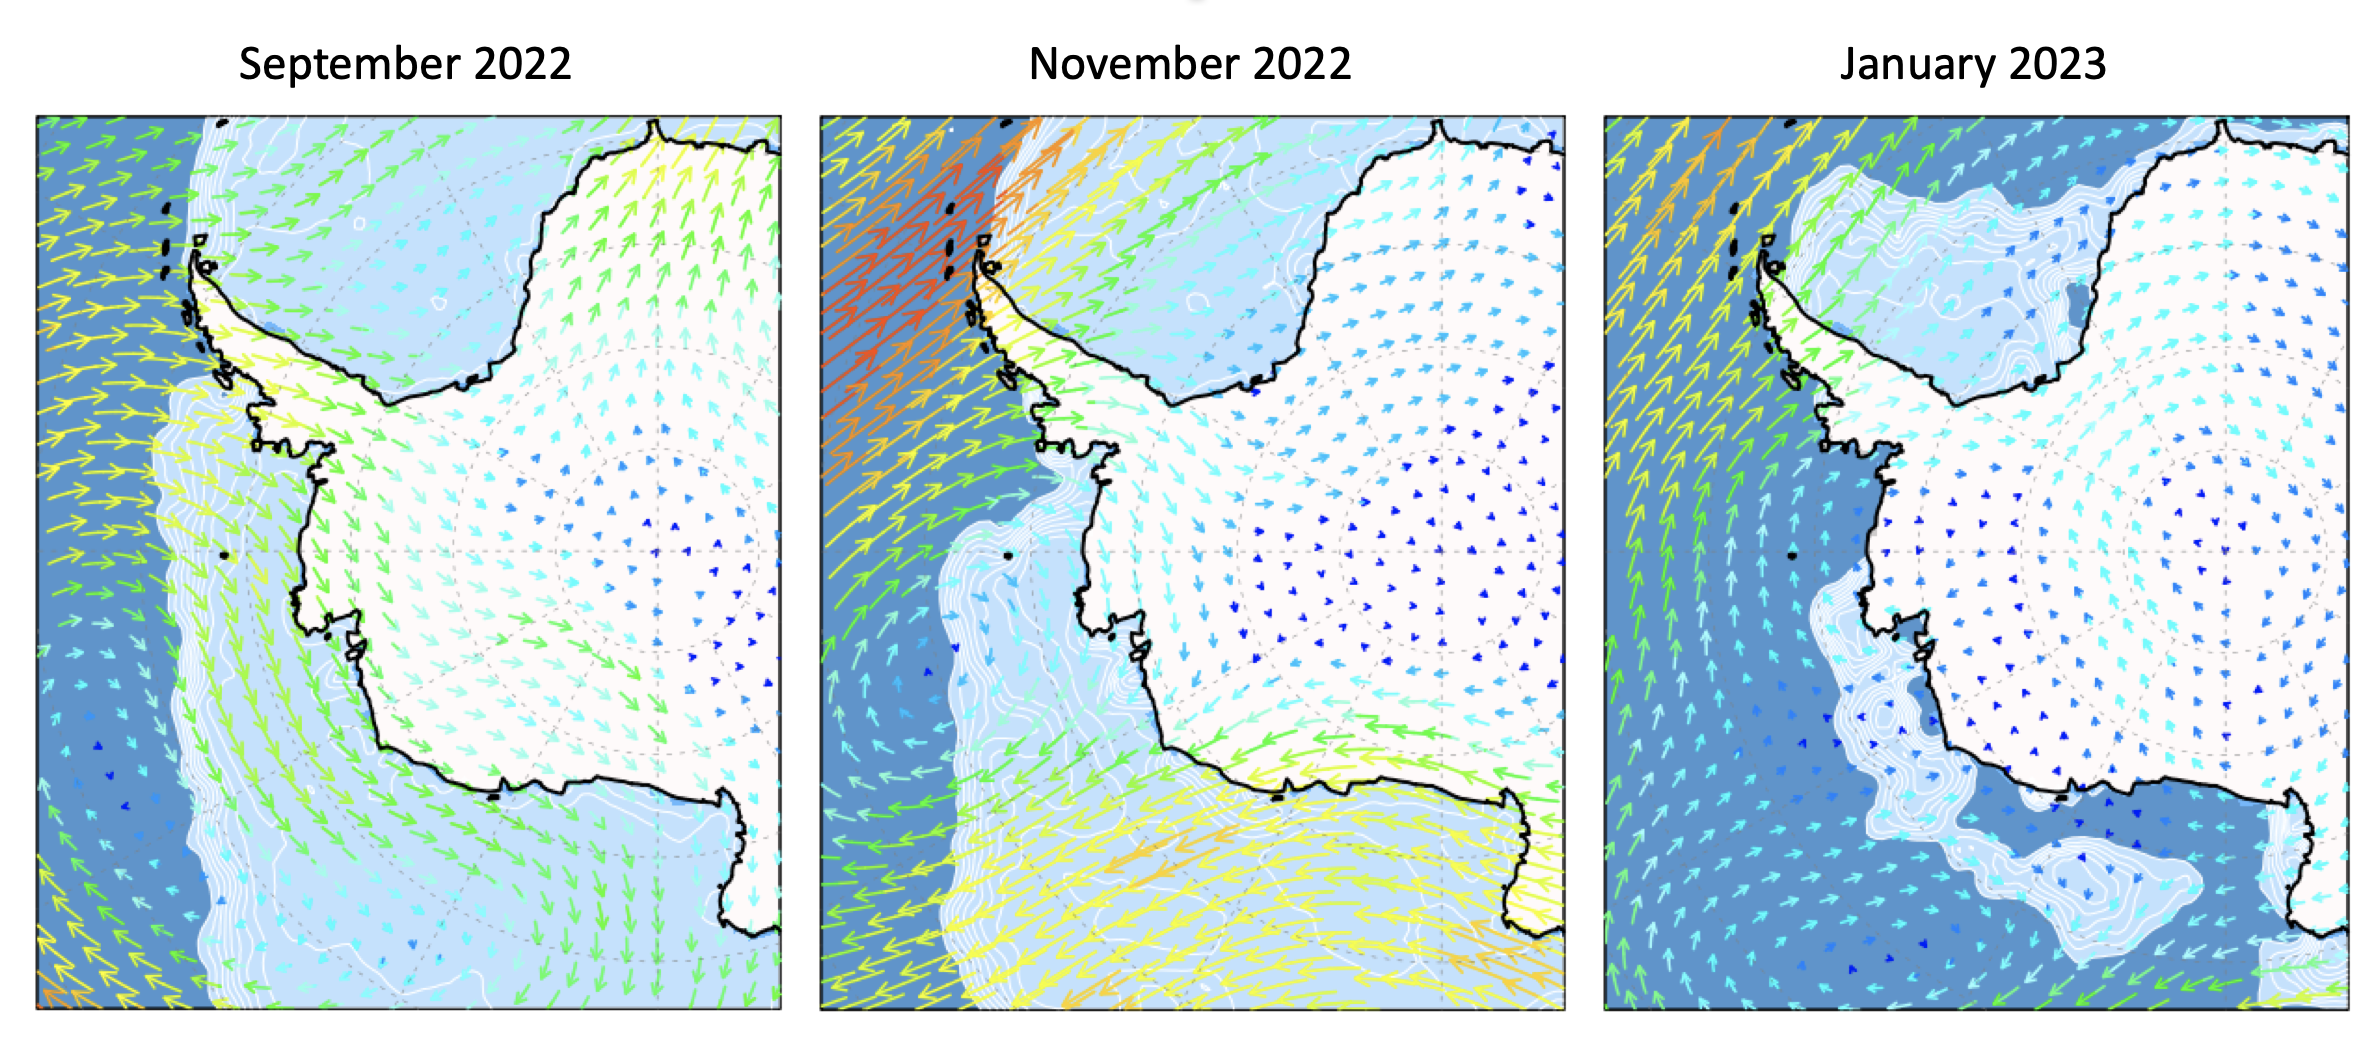
Figure 3 shows the poleward advection of moist static energy onto, and to the west of, the Antarctic Peninsula. There is enhanced accumulation on the Antarctic Peninsula and along the Bellingshausen Sea coastline in September. The return flow from the dry Antarctic interior also corresponds to reduced snowfall in the Amundsen Sea embayment, as well as farther west. In November, a substantial reduction in the sea ice cover occurs just to the west of the Antarctic Peninsula – corresponding to the poleward cyclonic transport of moist static energy. This intriguing indentation in the sea ice edge is generally not found in prior years and suggests the importance of warm air advection onto this part of the sea ice edge during this melt season. To the west, the equatorward return flow may also have mechanically widened coastal polynyas and advected the ice cover off of the continental shelf. The Ekman drift of coastal sea ice cover towards warm lower latitudes may have been significant in other locations of the Antarctic due to pervasive low pressure anomalies. The remaining summer 2023 ice cover in the South Pacific is shown to be located in the northern Amundsen Sea, near the axis of the mean cyclonic circulation anomaly. Both local and remote influences on Antarctic sea ice cover continue to be a focus of research study.
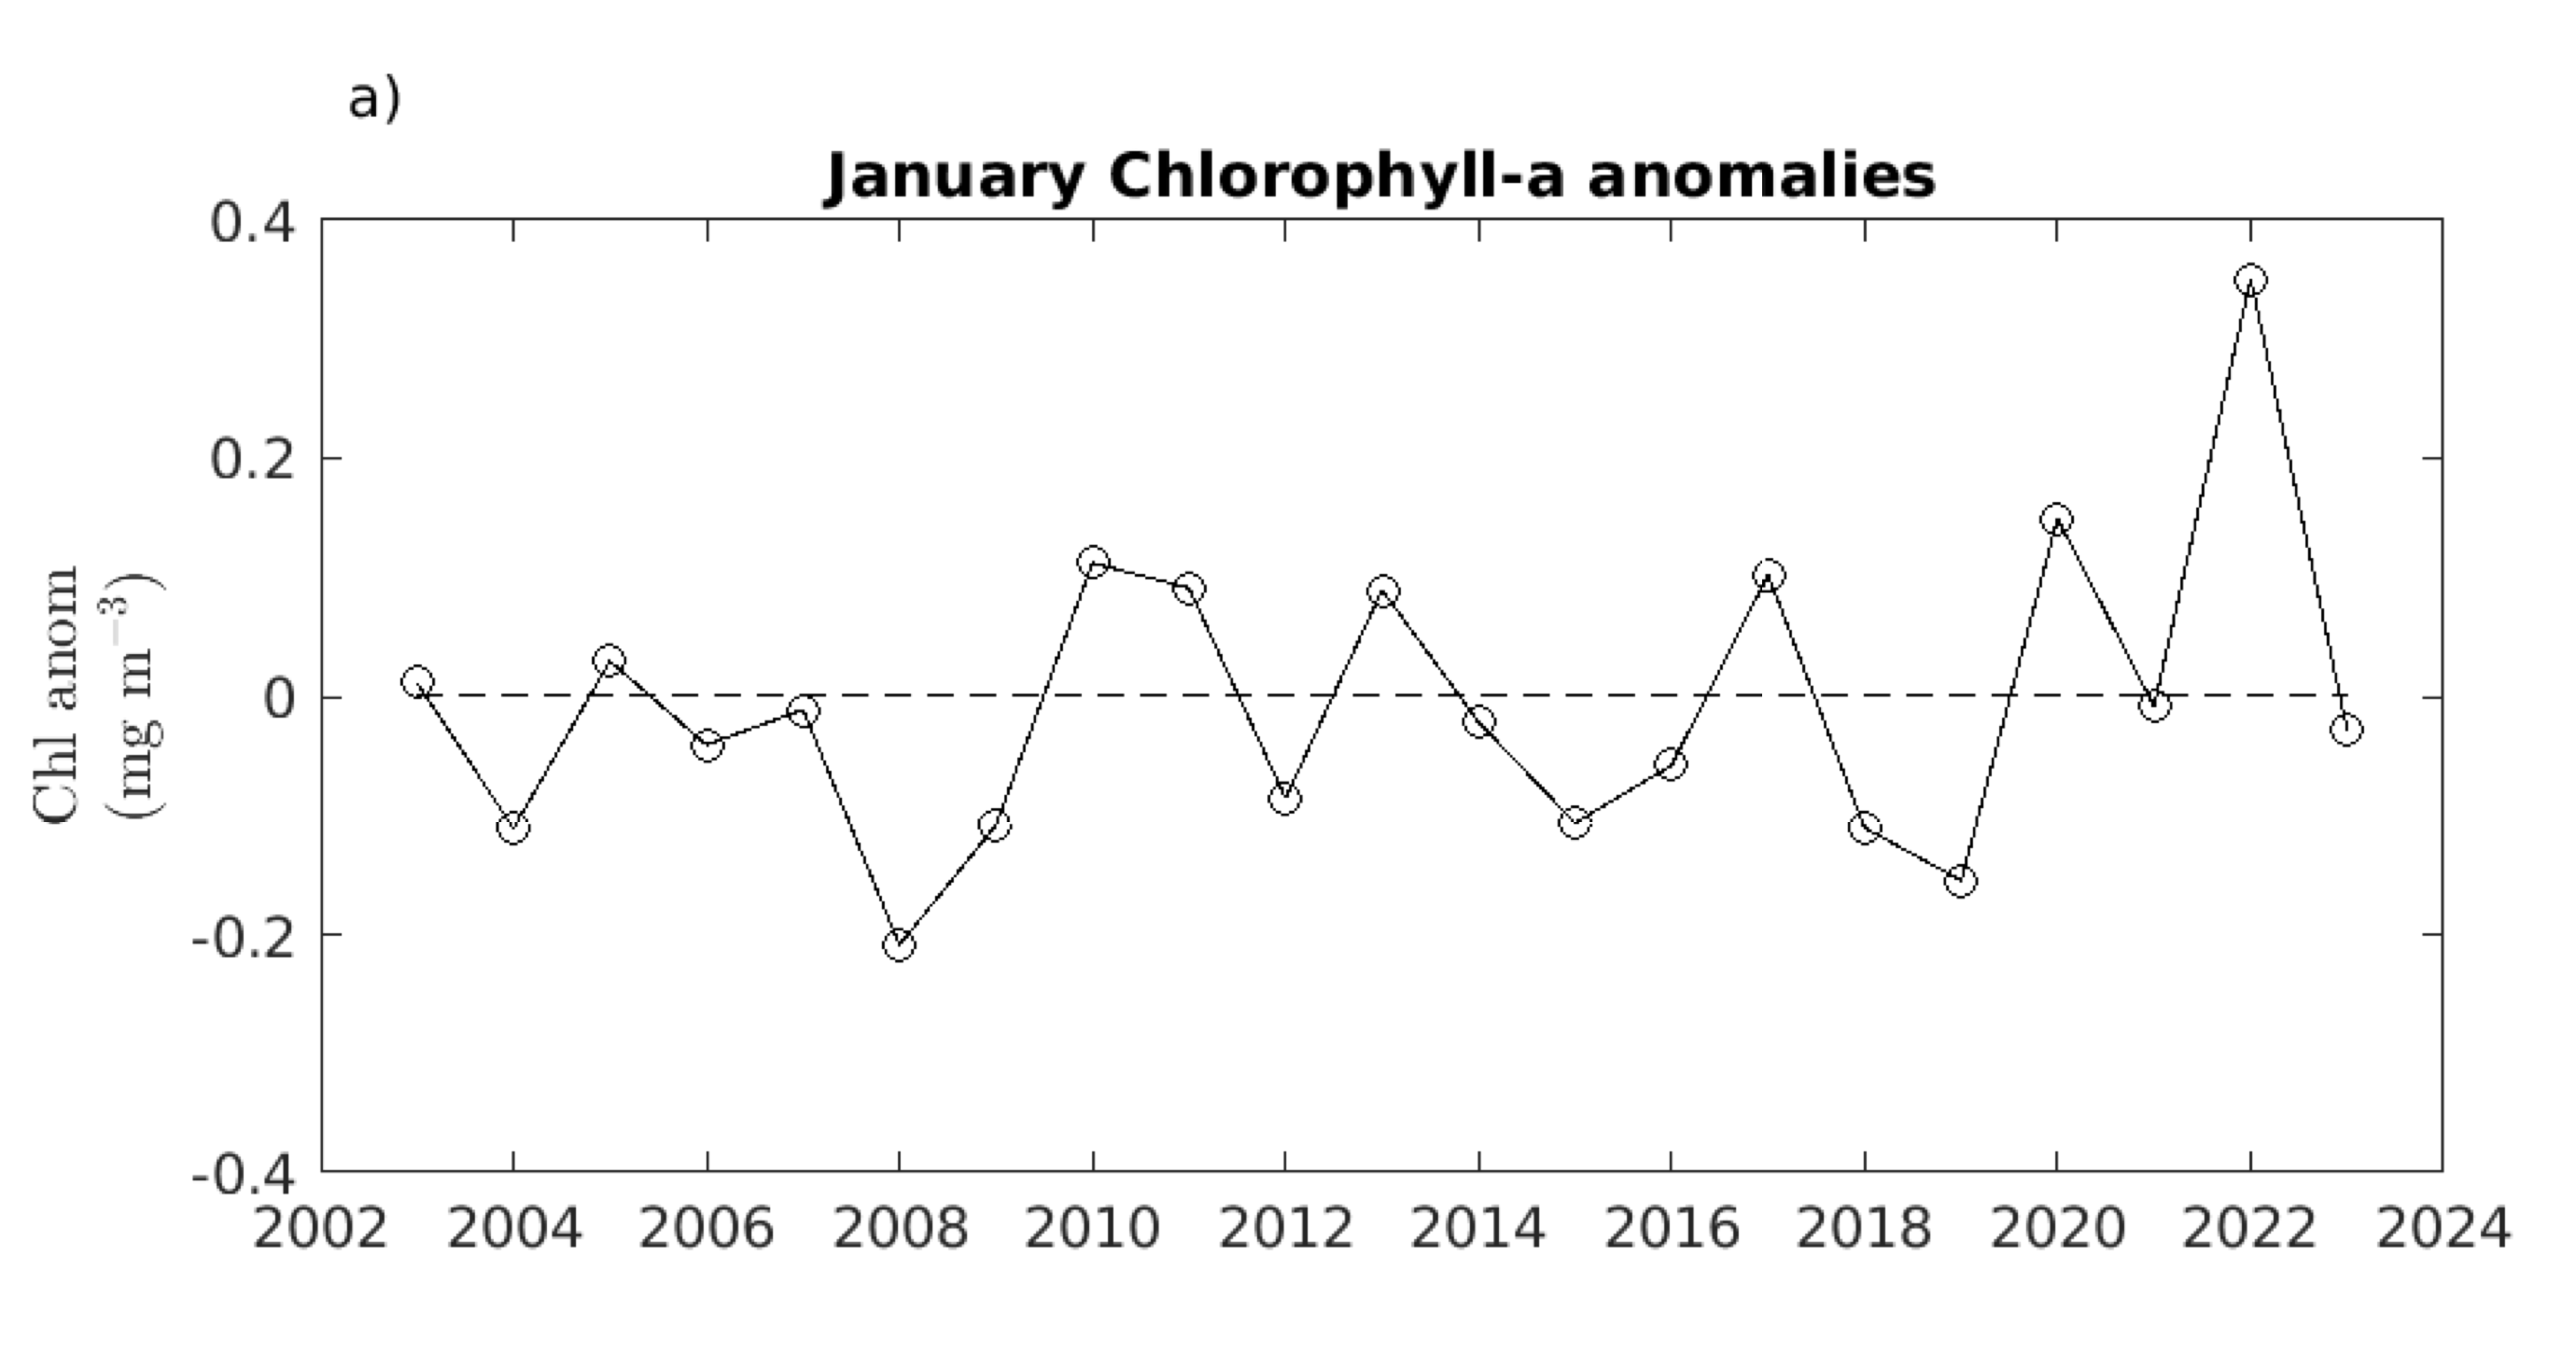
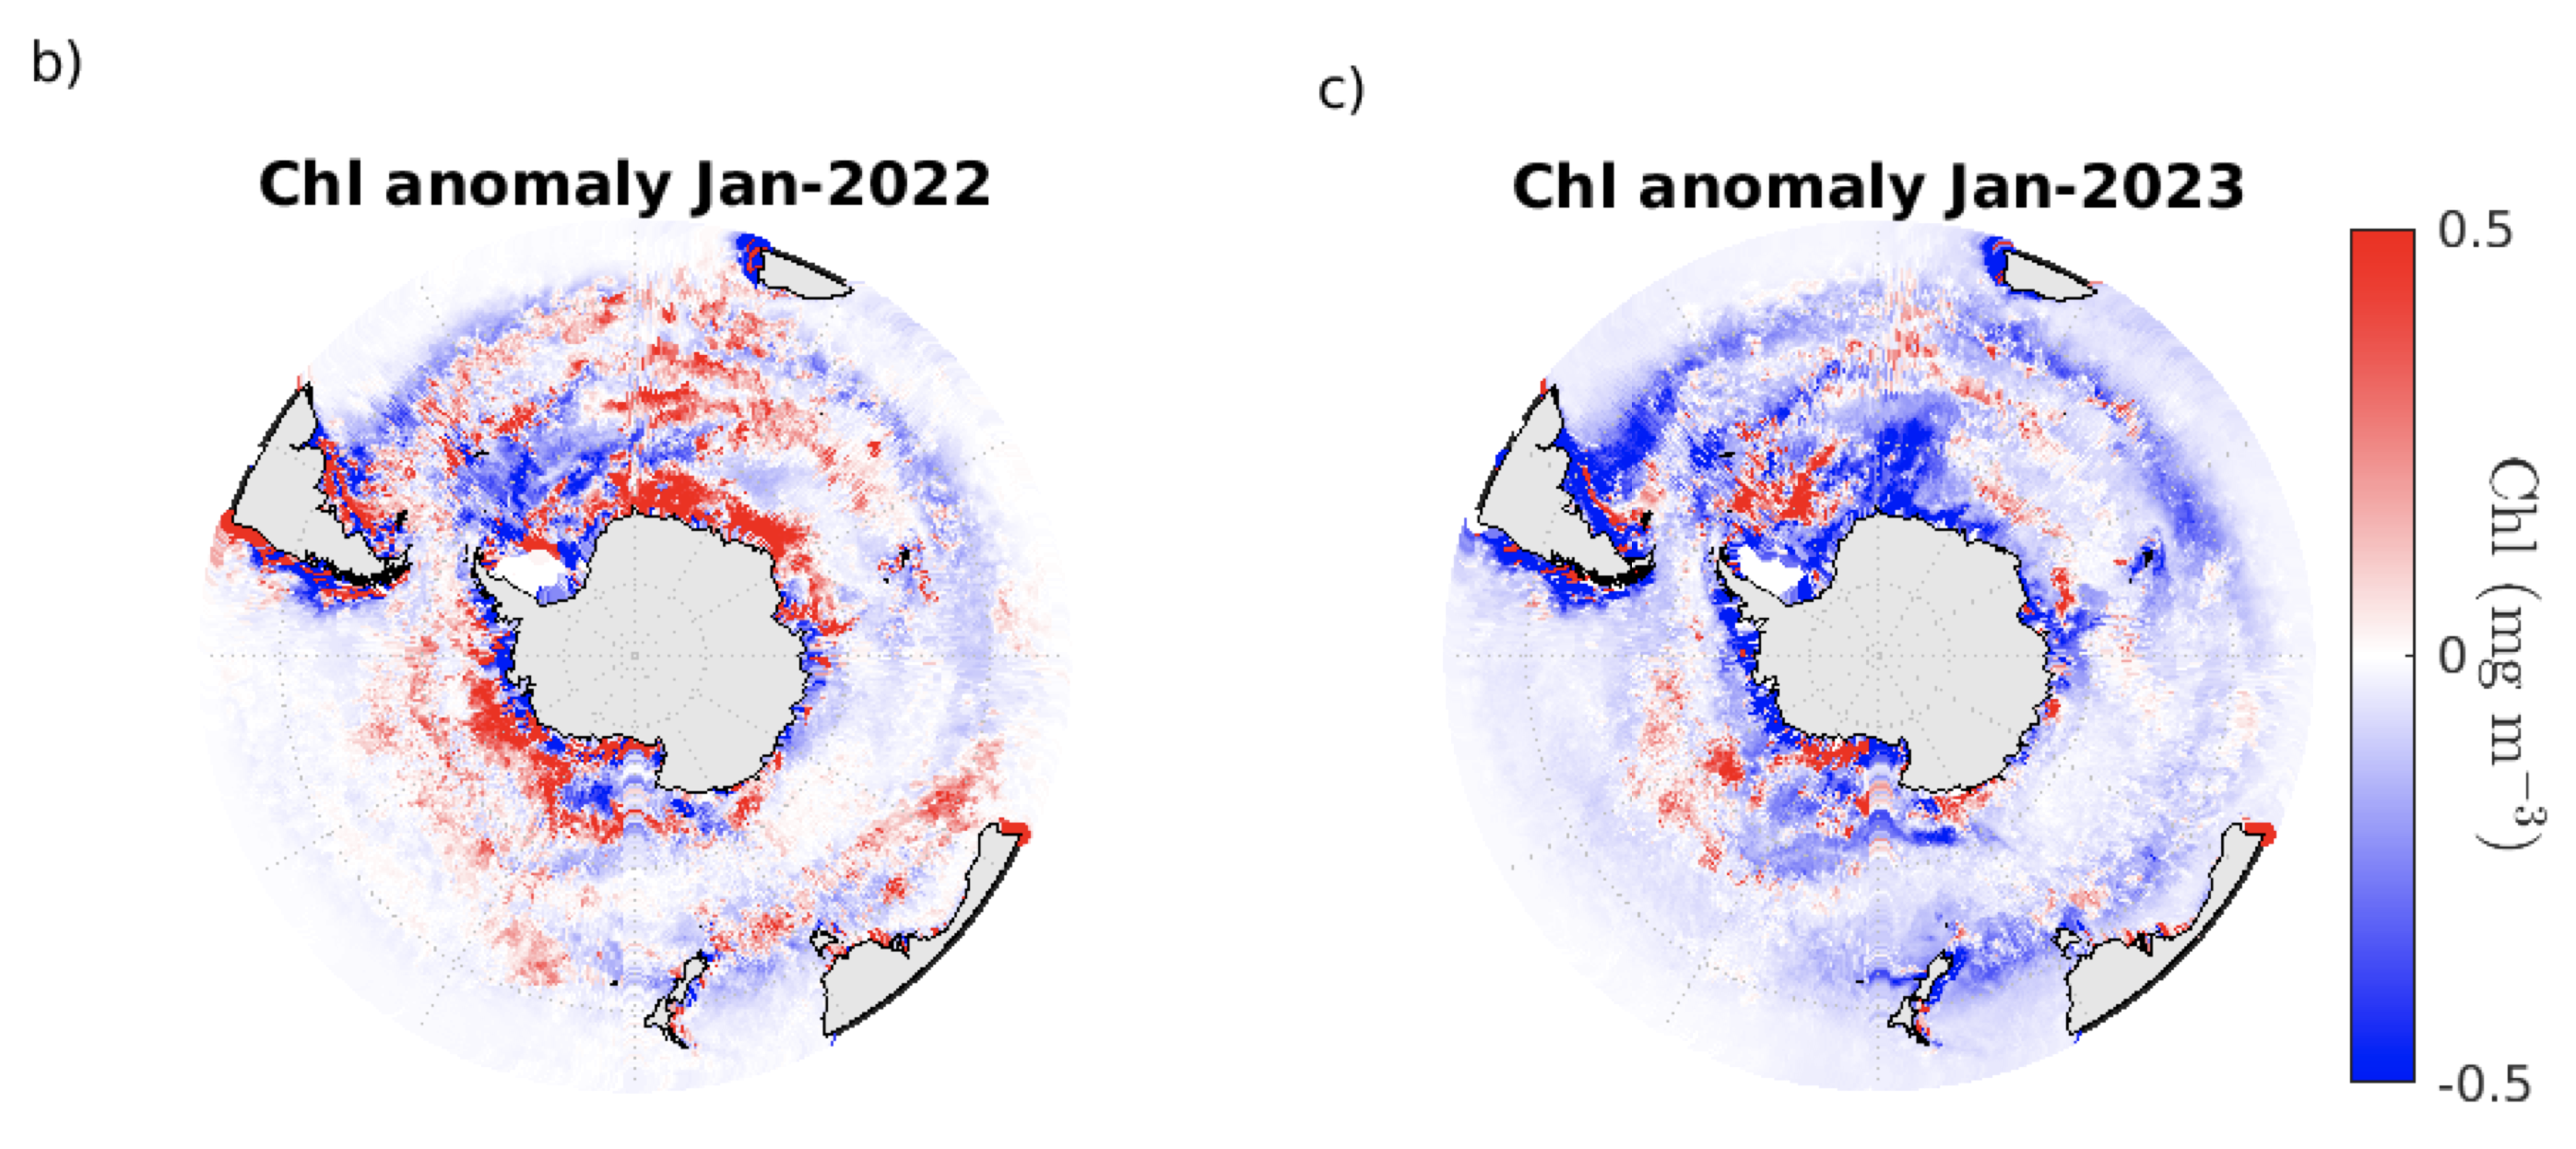
Interannual variations in Antarctic phytoplankton biomass are largely driven by the extent of ice-free ocean area in the Southern Ocean (Behrenfeld et al., 2017). Reduced sea ice coverage yields a larger oceanic area for phytoplankton to grow, while thinner sea ice (lower sea ice fraction) diminishes the albedo of the ice-covered Southern Ocean and relaxes light limitation of phytoplankton growing underneath sea ice (Arteaga et a., 2020). The time series of changes in satellite-based surface chlorophyll-a (a proxy for phytoplankton biomass) for the month of January shows a large positive anomaly in 2022 for the Bellingshausen and Ross Sea region (Figure 4a). This peak represents the largest positive anomaly in chlorophyll concentration since the beginning of the MODIS-Aqua record in 2002. High anomalies in surface chlorophyll concentration for January 2022 are observed both to the east and west of the Antarctic peninsula, covering most the Pacific and Atlantic sectors of the Southern Ocean (Figure 4b). Interestingly, the mean surface chlorophyll concentration for the Bellingshausen and Ross Sea region in 2023 returned back to the climatological average over the 2002-2023 period (Figure 4a and 4c), despite the record low sea ice extent observed in the austral summer of 2023 (Figure 1). The mechanistic connection between alterations in sea ice extent and phytoplankton biomass also relies on wind-driven mixing and the vertical supply of nutrients to the surface ocean during deep winter convection, and the degree of coupling between phytoplankton growth and grazing rates by zooplankton (small animals) set by ocean physics. Thus, anomalies in phytoplankton biomass over the growing season (spring—summer) might be further explained by examining alterations in surface ocean mixing during the precedent winter season.
References:
Arteaga, L.A., Boss, E., Behrenfeld, M.J. et al. Seasonal modulation of phytoplankton biomass in the Southern Ocean. Nat Commun 11, 5364 (2020). https://doi.org/10.1038/s41467-020-19157-2
Behrenfeld, M., Hu, Y., O’Malley, R. et al. Annual boom–bust cycles of polar phytoplankton biomass revealed by space-based lidar. Nature Geosci 10, 118–122 (2017). https://doi.org/10.1038/ngeo2861