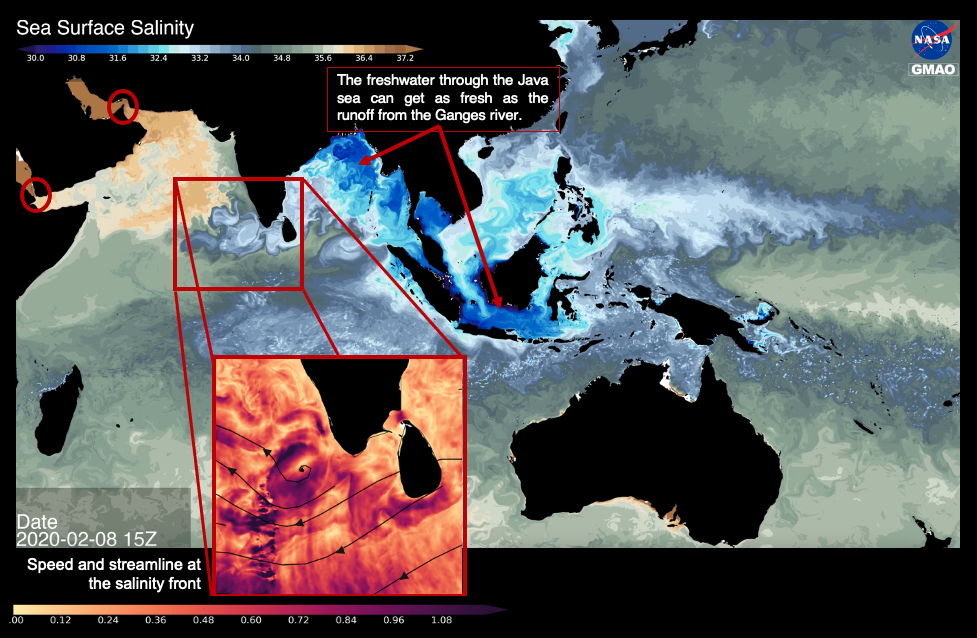
Sea surface currents and salinity near the maritime continent
The Indonesian Throughflow (ITF) is the only low-latitude gateway for export of large amounts of heat and freshwater from the Pacific to the Indian Ocean. The ITF affects the atmosphere–ocean coupling with potential impacts on ENSO (El Niño–Southern Oscillation) and the Asian monsoon. On average, 15 Sverdrup (1Sv= 1 million cubic meters per second) of Pacific Ocean water enters the Indian Ocean, regulating the mean state and the meridional overturning of the Indian and Pacific Oceans. The flow passes through several passages. Some of these passages are deep. For example, the Ombai Strait with sill depth of 1,250 m carries 5 Sv, and the Timor Passage with sill depth of 1,890 m transports 7.5 Sv into the Indian Ocean. Some of the passages are quite narrow and shallow. For example, Lombok Strait is only 35 km wide and 300m deep. The speed of the 2.6 Sv flow that funnels through Lombok Strait can get larger than 1 m/s. The complex system of these passages is not well resolved in most earth system models used for climate prediction, resulting in misrepresentation of the transport through the ITF.
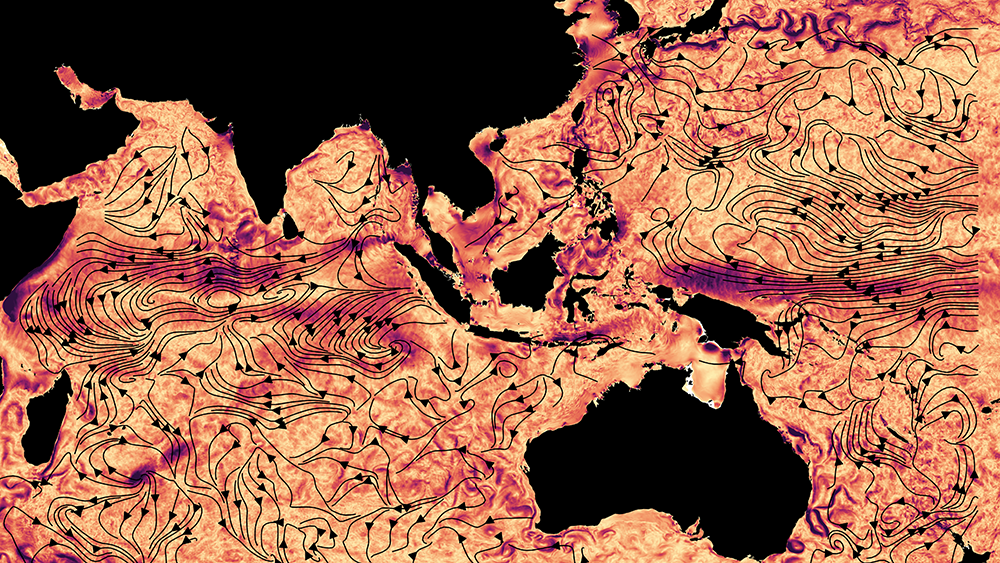
The Goddard Earth Observing System (GEOS) atmospheric model coupled with Massachusetts Institute of Technology general circulation (MITgcm) ocean model was run for 14 months (with start date of January20th, 2020) at a horizontal resolution of ~6-7 km atmosphere, 2-4 km ocean, which better resolve the flow through these narrow passages. The resolution allows sub-mesoscale features such as Mindanao and Halmahera eddies off the coast of Philippines and New Guinea to be captured. Figure1 and the animation of Sea Surface Salinity reveals the detailed spatial and temporal changes in the flow of freshwater. For example, salinity at all passages is maximum in October consistent with observations. The surface current velocity in Figure 2 highlights major oceanographic features such as the North Equatorial Current (NEC) and the Kuroshio Current. The animation of surface current velocity reveals features such as eastward propagation of Kelvin Waves from the equatorial Indian Ocean.