

The Exceptional Warmth over Eurasia during JFM 2020: Role of the Tropics
1. Introduction
According to the World Meteorological Organization, 2020 was one of the three warmest years on record. During the first three months of that year, much of northern Eurasia experienced record high temperatures. The Arctic Oscillation (AO), and the North Atlantic Oscillation (NAO) also had near record or record positive values during those three months. Numerous studies have shown that the AO has substantial impacts on the temperature over much of Eurasia while the NAO appears to be an important driver of temperature variability over Europe (see Schubert et al. 2022, and references therein). Our focus is on understanding how forcing from the tropics acted to maintain the above atmospheric modes well beyond their typical submonthly time scales, and thereby contributed to the development of the exceptional warmth over Eurasia during those months.
Our approach is to employ a "replay" methodology developed in the GMAO (Takacs et al. 2018) in which large ensembles of simulations with the NASA GEOS AGCM are constrained to remain close to MERRA-2 over specified regions of the tropics (see Table 1). The idea being that if the prescribed weather (including all associated heating patterns) inside the specified replay region has an impact on the weather (e.g., on heat wave generation) in remote regions through some teleconnection mechanism, we will see this remote impact via changes in the ensemble mean and/or variability.
2. The Results
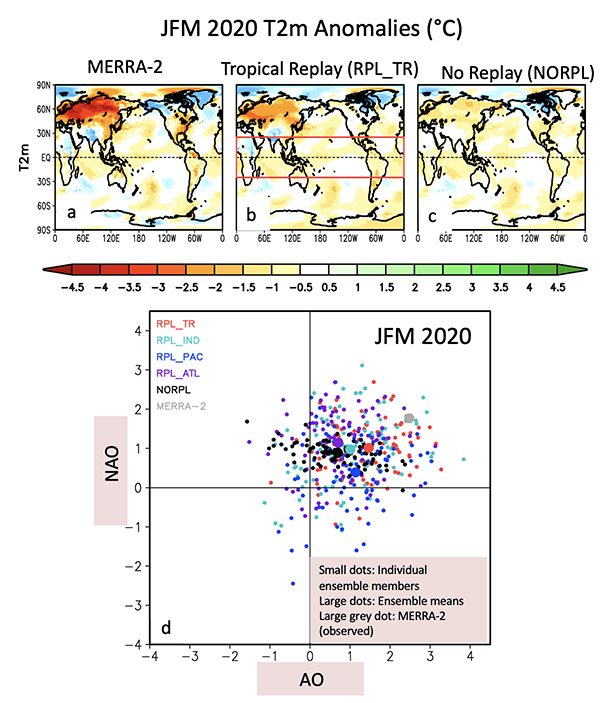
Figure 1a highlights the exceptionally warm temperatures (T2m) that occurred over Eurasia during JFM of 2020 based on MERRA-2. The results of replaying the tropics (RPL_TR) are shown in Fig. 1b, while the no replay (NORPL) results are shown in Fig. 1c. Clearly, RPL_TR produces considerably more warming over Eurasia than NORPL, indicating that forcing from the tropics is playing an important role. The amplitude of the warming is however considerably weaker than what actually occurred (Fig. 1a). Keeping in mind that the model results are an average of 90 ensemble members, we next look at the individual ensemble members to determine if such an extreme observed event nevertheless falls within the model’s ensemble spread. Here, rather than focusing on T2m, we examine the indices of the AO and NAO - the two modes that appear to have played a major role in the warming over Eurasia.
Figure 1d shows a scatterplot of the AO and NAO indices for all of our simulations (see Table 1). What is immediately clear is that the observed (MERRA-2) value lies at the fringes of the cloud of points making up the model ensemble. In fact, for NORPL, the observed is an impossible event: the MERRA-2 value lies far outside the cloud of black points. It turns out that tropical replay increases the probability of the observed extreme AO amplitude occurring in the simulations from zero (without replay) to 11%. It also increases the probability of the observed NAO amplitude occurring in the simulations from zero to 12%, partly by increasing the NAO’s intra-ensemble variability. We further show in Schubert et al. (2022), that it was primarily forcing from the tropical Pacific and Indian Ocean regions that acted to maintain the positive phase of the AO, while it was primarily forcing from the tropical Indian Ocean and Atlantic regions that produced positive NAO-like responses.
While replay helps to identify those remote regions of the globe that may have contributed to the warming over Eurasia, it does little to tell us about the actual dynamical mechanisms by which forcing in those regions impacted the above atmospheric modes, leading to the extraordinary warmth that occurred over Eurasia during JFM 2020. Given the substantial zonal (east-west) component of the circulation associated with the AO, we address this issue by looking more generally at what is driving the zonal mean circulation and temperature changes.
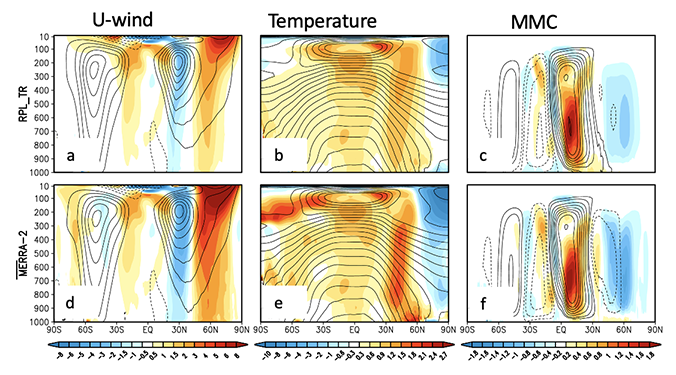
Figure 2 shows the zonal mean u-wind, temperature, and mean meridional circulation (MMC) anomalies for RPL_TR and MERRA-2. Focusing on the results poleward of 25N° (note that RPL_TR is by design forced to remain close to MERRA-2 between +/-25° latitude) we see similar patterns of zonal wind anomalies (cf. panels a and d), consisting of a strengthening of the winds on the equatorward flank of the subtropical jet, together with negative anomalies centered at about 30°N, and positive anomalies centered at about 60°N, consistent with a positive AO. The wind anomalies are to a large extent reflected (via the thermal wind relationship) in the temperature anomalies with both MERRA-2 and RPL_TR showing a deep layer of warming in the troposphere between 30°N and 60°N (panels b and e), roughly coinciding with the latitudes of surface warming. Panels c and f show that the warming coincides with the latitudes of anomalous subsidence (associated with an anomalous Ferrel Cell).
Further analysis (see Schubert et al. 2022) based on the work of Seager et al. (2003) allows us to conclude that it was primarily the stationary eddies associated with the Pacific North American (PNA) pattern and NAO that drove the anomalous descending motion that produced the observed deep layer of warming in the NH extratropics, and helped maintain the persistent and large amplitude positive AO.
| Name | Replay region |
| NORPL | none |
| RPL_TR | Tropics 25°S - 25°N |
| RPL_PAC | Pacific Ocean region (25°S - 25°N, 120°E - 120°W) |
| RPL_ATL | Atlantic Ocean region (25°S - 25°N, 120°W - 0°) |
| RPL_IND | Indian Ocean region (25°S - 40°N, 0-120°E) |
References:
Edmon , H. J., Jr., Hoskins, B. J., & McIntyre, M. E. (1980). Eliassen-Palm Cross Sections for the Troposphere, Journal of Atmospheric Sciences, 37(12), 2600-2616.
Gelaro, R., W. McCarty, M.J. Suárez, R. Todling, A. Molod, L. Takacs, C.A. Randles, A. Darmenov, M.G. Bosilovich, R. Reichle, K. Wargan, L. Coy, R. Cullather, C. Draper, S. Akella, V. Buchard, A. Conaty, A.M. da Silva, W. Gu, G. Kim, R. Koster, R. Lucchesi, D. Merkova, J.E. Nielsen, G. Partyka, S. Pawson, W. Putman, M. Rienecker, S.D. Schubert, M. Sienkiewicz, and B. Zhao, 2017: The Modern-Era Retrospective Analysis for Research and Applications, Version 2 (MERRA-2). J. Climate, 30, 5419–5454.
Molod, A. M., L. Takacs, M. Suarez, and J. Bacmeister, 2015: Development of the GEOS-5 atmospheric general circulation model: evolution from MERRA to MERRA2. Geosci. Model Dev., 8, 1339-1356, doi:10.5194/gmd-8-1339-2015.
Schubert, S.D, Y. Chang, A. M. DeAngelis, H. Wang, and R.D. Koster, 2021: On the Development and Demise of the Fall 2019 Southeast U. S. Flash Drought: Links to an Extreme Positive IOD, J. Climate, 34(5), 1701-1723.
Schubert, S.D., Y. Chang, A.M. DeAngelis, R. D. Koster, Y.-K. Lim, and Hailan Wang, 2022: Exceptional Warmth in the Northern Hemisphere during January through March of 2020: The Roles of Unforced and Forced Modes of Atmospheric Variability. Accepted for publication in J. Climate, 2022.
Seager, R., Harnik, N., Kushnir, Y., Robinson, W., & Miller, J., 2003: Mechanisms of Hemispherically Symmetric Climate Variability, Journal of Climate, 16(18), 2960-2978.
Takacs, L. L., M. J. Suárez, and R. Todling, 2018: The stability of incremental analysis update. Mon. Wea. Rev., 146, 3259–3275.