

Simulating the 2022 Mauna Loa volcanic eruption using the GEOS model
Sulfur dioxide (SO2) is an air pollutant that is harmful to both human health and the environment. It is released into the atmosphere through the burning of fossil fuels and from natural sources, such as volcanoes. Models such as GEOS can be used to simulate the release, dispersion, and chemical transformation of SO2 in the atmosphere. To do so, the model relies on assumptions about the emission sources of SO2. These data, compiled from different sources, are typically only available with a time lag of months to years, and thus not suitable to capture unpredictable events in a near real-time system such as NASA’s GEOS composition forecast (GEOS-CF; Keller et al., 2021). This problem can be solved by assimilating atmospheric observations - which are available with much shorter latency - into the model. The assimilation of atmospheric constituents has long been used by the GMAO for stratospheric ozone and aerosols. More recently, the GEOS Constituent Data Assimilation System (CoDAS; Wargan et al., 2020) has been expanded to include carbon gases as well as reactive tropospheric gases, including SO2. Assimilation of SO2 has the potential to significantly improve GEOS-CF’s ability to capture air pollution events such as volcanic eruptions in near real-time, as demonstrated by the 2022 eruption of Mauna Loa.
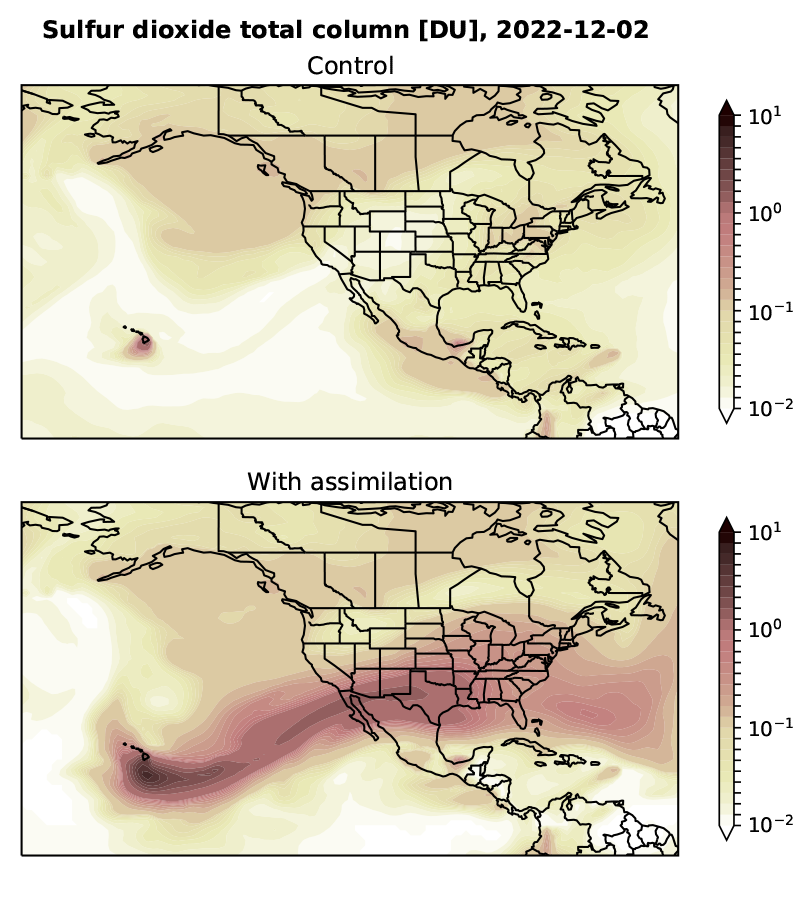
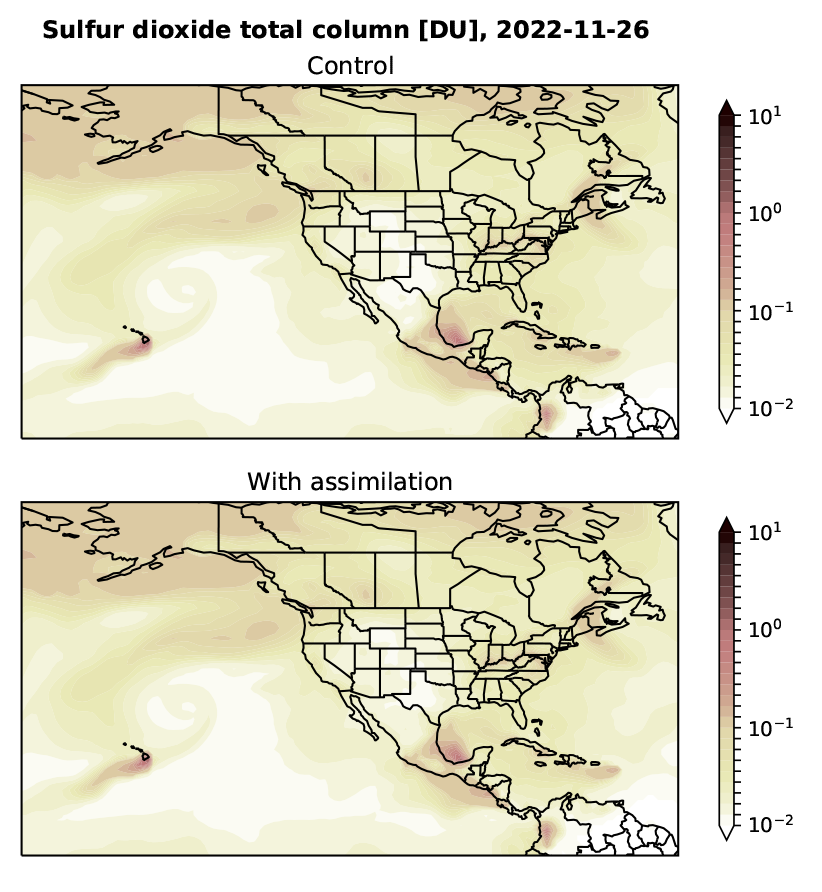
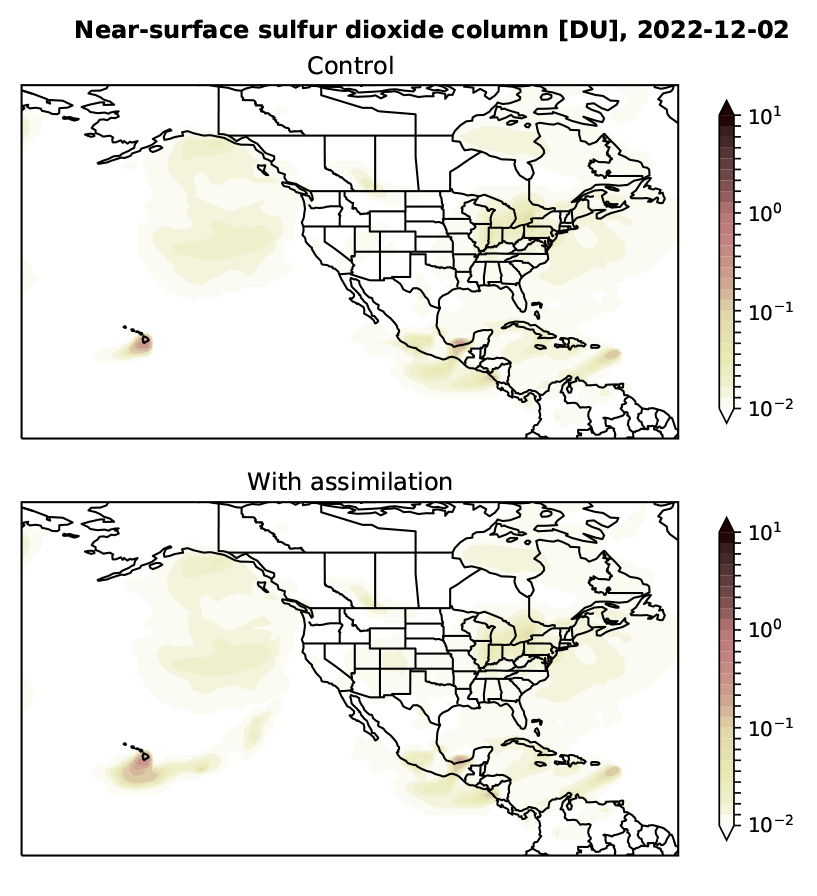
Hawaii’s Mauna Loa, the world’s largest active volcano, began erupting on Nov. 27, 2022 after almost 40 years of inactivity. The resulting SO2 plume was first detected by NASA’s OMI SO2 instrument on Nov. 28 (https://so2.gsfc.nasa.gov/pix/daily/1122/hawaii_1122z.html). Experiments using the GEOS model with GEOS-Chem chemistry highlight how incorporating these observations into a global Earth System Model can be used to simulate an event such as the Mauna Loa eruption in near real-time. To do so, two experiments were conducted: A control run, where no assimilation was performed and only the default SO2 emission inventories were being used, and a second run where OMI SO2 was assimilated into the model on a continuous basis. The assimilation run diverges markedly from the control run after the eruption (Figure 1), while the two experiments show similar SO2 fields on Nov. 26 just prior to the eruption (Figure 2). Upon ingestion of the first satellite observation of the volcanic plume on Nov. 28, the assimilation simulation adds a large SO2 increment just east of Mauna Loa, consistent with the prevailing winds at that time. The SO2 plume then gets dispersed eastward, and subsequent assimilation updates further refine the magnitude and structure of the plume with each new available satellite overpass (see animation). The simulated volcanic plume is almost entirely confined to the middle to upper troposphere, and no significant change in near-surface SO2 concentrations (i.e., SO2 within the planetary boundary layer) outside of the immediate source region are apparent from the model simulations (Figure 3).
The Mauna Loa eruption shows the value of expanding GEOS CoDAS to tropospheric trace gases such as SO2, enabling the GMAO to create a more realistic representation of the composition of the troposphere. This capability will be included in future GMAO products, including the next version of GEOS-CF and the atmospheric composition reanalysis.
References
Keller, C. A., K.E. Knowland, B. N. Duncan, J. Liu, D. C. Anderson, S. Das, R. A. Lucchesi, E. W. Lundgren, J. M. Nicely, E. Nielsen, L. E. Ott, E. Saunders, S. A. Strode, P. A. Wales, D. J. Jacob, and S. Pawson, 2021. Description of the NASA GEOS Composition Forecast Modeling System GEOS-CF v1.0 . Journal of Advances in Modeling Earth Systems , 13 (4), e2020MS002413. doi: 10.1029/2020MS002413
Wargan, K., B. Weir, G. Manney, S.E. Cohn, and N.J. Livesey, 2020. The anomalous 2019 Antarctic ozone hole in the GEOS Constituent Data Assimilation System with MLS observations. J. Geophys. Res. - Atmos , 125, e2020JD033335. doi: 10.1029/2020JD033335