

Continental Patterns of Bird Migration Linked to Climate Variability
For ~100 years, for management purposes, the continental patterns of avian migration in North America have been described in the context of three or four primary flyways. We have introduced a new concept for spatial patterns of bird migration that identifies two regions across the contiguous United States (CONUS). This approach, which is intrinsically different from the “flyway concept”, has leveraged a unique data set that uses machine learning techniques to convert radar-based observations into bird migration measures. This data enabled us to divide the U.S. into two regions, each reflecting a specific year-to-year variability of bird migration arrival date in Spring. Our spatial framework allowed us to explore long-term variability of bird migration and the associated large-scale climatic drivers specific to the western and eastern U.S.
We used nocturnal migration data compiled from the NOAA’s Next Generation Radar (NEXRAD) system—a network of 143 stations across CONUS. The bird migration data has been developed using a convolutional neural network (CNN) to exclude precipitation contamination and subsequently quantify the phenology of migratory movements. To analyze the timing of migration we used median migration date (q50), defined as the date by which 50% of the cumulative passage occurred at each radar station from spring (1 March to 15 June) 1995 to spring 2018. Monthly meteorological data in this analysis are obtained from NASA’s MERRA-2.
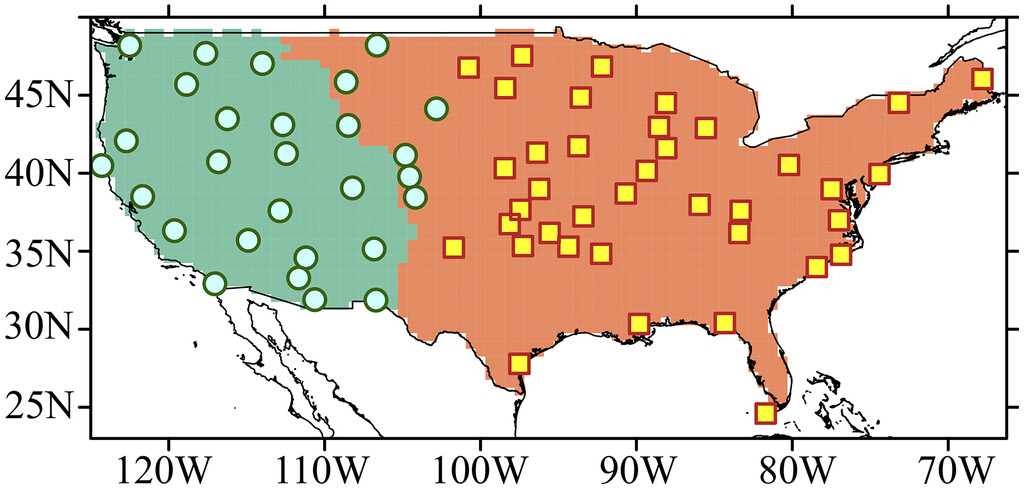
Leveraging NEXRAD time-series we objectively identified two sub-regions based on similarity of interannual variability of bird migration across the United States. Each region had a high value of “intra-regional”—the mean correlation between each regional time-series and its stations—assuring homogeneity of the region. Also, the low value of “inter-regional” similarity, calculated by the correlation between regional mean time-series, satisfied separability of the regions. These two regions, representing the interannual variability of median migration date in the western and eastern U.S., were separated at about 102 W longitude (Fig. 1). This coherent “spatial signal” enabled us to better identify the large-scale climatic drivers of interannual and decadal variability of avian migration timing at the continental scale.
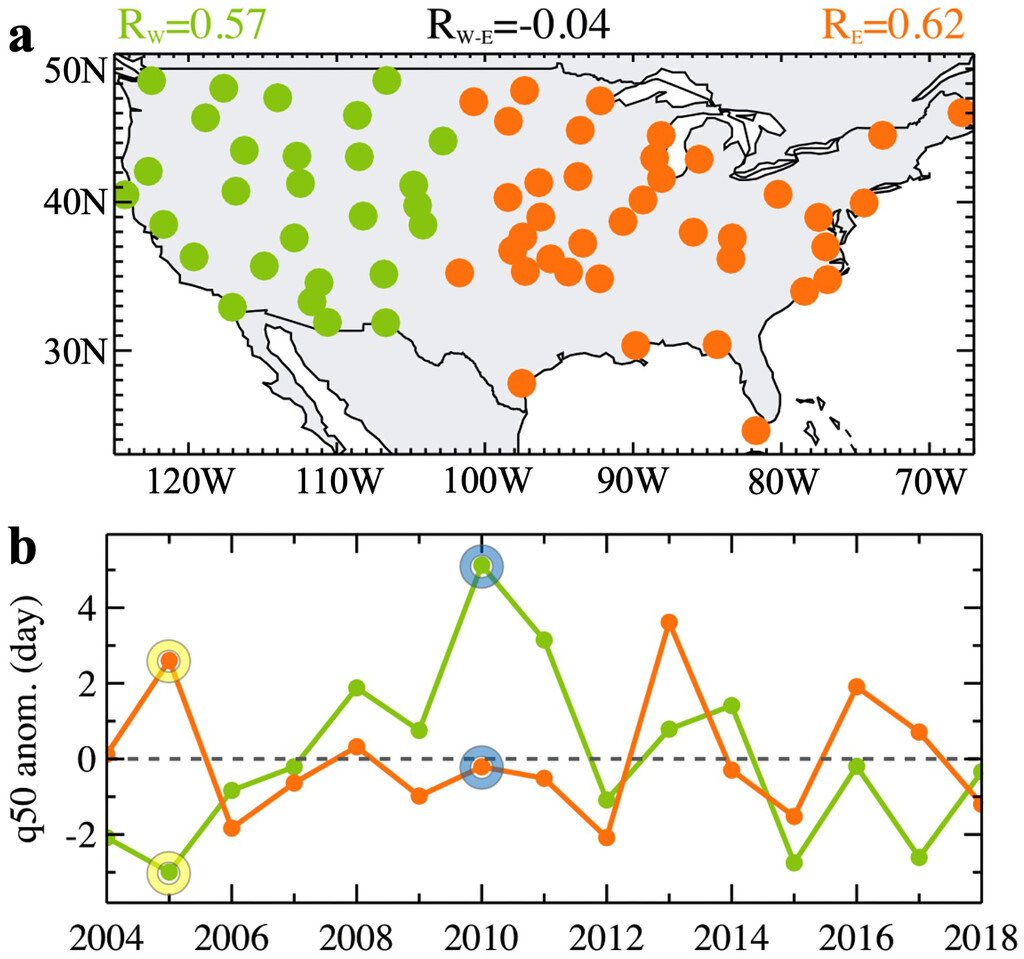
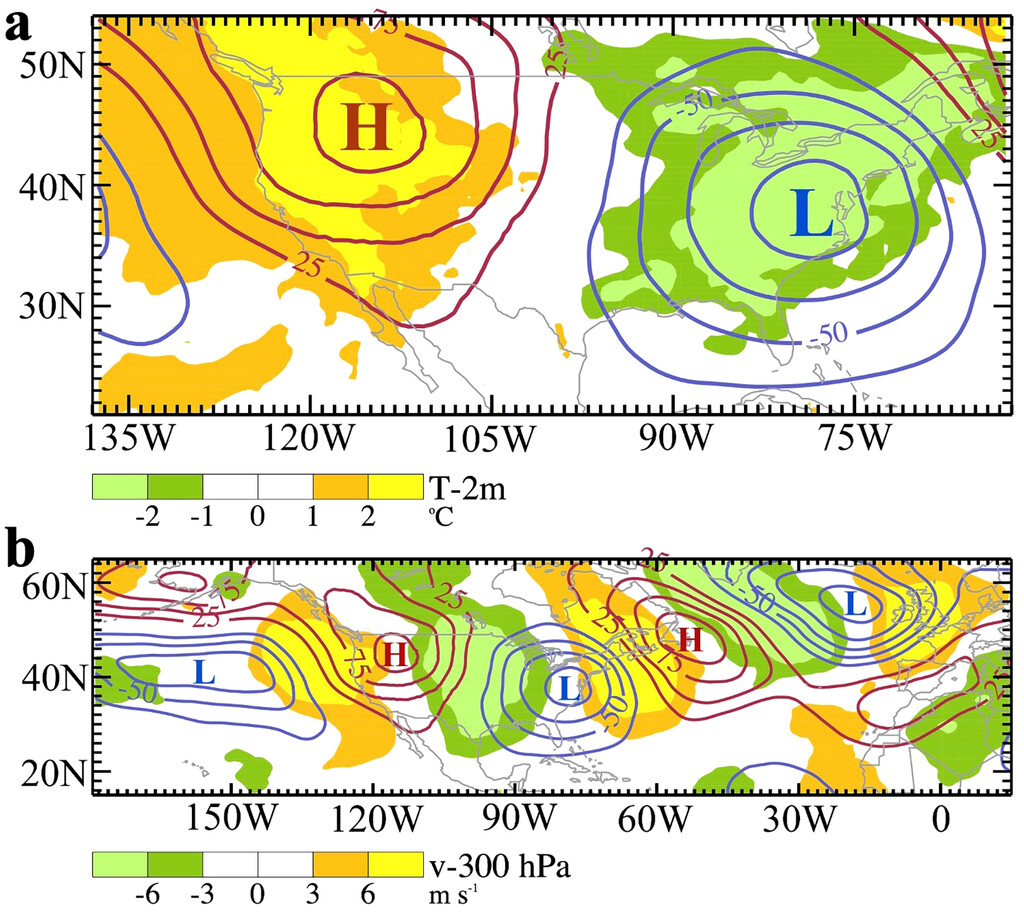
For example, comparing the mean time-series of the two regions (Fig. 1b) allowed us to identify years (2005 and 2010) with notably east-west contrast in median passage date anomalies. We attributed this zonal dipole pattern, in part, to the near surface air temperature (Fig. 2a) and, to a lesser degree, the meridional winds (Fig. 2b). The warmer than normal temperatures and southerly anomalies over the western region in 2005 favored an earlier arrival than in 2010. The opposite pattern was apparent for the eastern region. The strong linkage with temperature is likely due to the fact that temperature serves as a surrogate for resources. This zonal configuration, apparent in temperature, meridional winds, and geopotential heights, resembles a pattern that is consistent with that of a quasi-stationary atmospheric Rossby wave that extends from the central North Pacific into the North Atlantic (Fig. 2b).
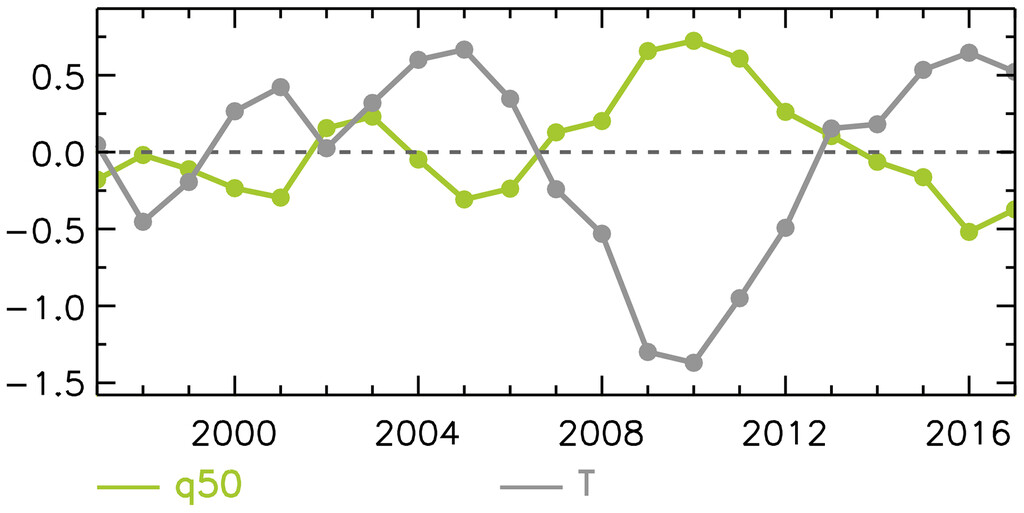
We further explored the interannual associations and found that the western region had a significant negative correlation with T-2m averaged over the same area (𝑅=−0.79R=−0.79) for 1996-2018. The eastern region showed relatively weaker association with regional variability, but its link to teleconnection patterns was stronger than that of the western region. The highest correlations were with East Pacific–North Pacific (EP–NP) (𝑅=0.58R=0.58), North Tropical Atlantic (𝑅=0.52R=0.52) and Arctic Oscillation (𝑅=−0.50R=−0.50) indices. To assess the extent to which these climate phenomena manifest the impact of ocean variability on bird migration, we evaluated the spatial correlation between q50 of the eastern region and large-scale SSTs (Fig. 3a). The spatial patterns of EP/NP and NTA can be particularly identified from the regions with significant correlations. Analysis of spatial correlation between 300-hPa geopotential heights and q50 showed that the impact of SST was likely reflected through Rossby waves that were excited over the tropical Pacific (Fig. 3b).
The western region, on the other hand, showed strong correlation only with geopotential heights over the same area and SSTs along the West Coast of North America (Fig. 4). The negative correlations with SST imply that the adjacent waters likely affected the region through temperature advection. A Rossby wave train originating from the tropical Pacific was also apparent (Fig. 4b), but it was much weaker and more spatially limited than the one shown for the eastern region.
This study shows that large-scale climatic phenomena, originating thousands of kilometers away in the tropical Pacific, can affect arrival date of migratory birds to North America in Spring. Future research is needed on fall migration patterns, species-specific response to climate variability, seasonal prediction skill of atmospheric phenomena that influence the migration system, and potential future changes of such phenomena.
More details about this study can be found in the related article (Dezfuli et al. 2022) and a NASA Earth Science News feature listed below.
References
Dezfuli, A., Horton, K.G., Zuckerberg, B., Schubert, S.D. and Bosilovich, M.G., 2022. Continental patterns of bird migration linked to climate variability. Bulletin of the American Meteorological Society, 103(2), pp.E536-E547. https://doi.org/10.1175/BAMS-D-21-0220.1
NASA Study: Climate Patterns Thousands of Miles Away Affect US Bird Migration: https://www.nasa.gov/feature/esnt/2022/nasa-study-climate-patterns-thousands-of-miles-away-affect-us-bird-migration