

Sub-city Scale Hourly Air Quality Forecasting by Combining Models with Observations
Air quality is a major health concern worldwide, leading to millions of premature deaths annually. In order to better understand this risk and mitigate its impact, accurate and timely air quality data are needed. While multiple information sources exist concerning surface-level air pollution, no individual source simultaneously provides large-scale spatial coverage, fine spatial and temporal resolution, and high accuracy. It is therefore necessary to integrate multiple data sources, using the strengths of each source to compensate for the weaknesses of others.
Here, we propose a method incorporating outputs of NASA’s GEOS Composition Forecasting (GEOS-CF) model system with satellite information from the European Space Agency’s TROPOspheric Monitoring Instrument (TROPOMI) and ground measurement data from the Environmental Protection Agency (EPA) network in the continental United States (US). The method uses linear regression to model relationships between these sources during the designated calibration period, as described below.

A representation of the proposed scheme for forecasting surface air quality is presented in Figure 1. The idea is to use outputs from a global atmospheric chemistry model (GEOS-CF) to drive estimates and forecasting at a coarse spatial resolution. Information from other data sources, especially satellites (TROPOMI), is then incorporated to help resolve finer spatial variabilities. This is done by identifying typical patterns in the data, e.g., representing systematic local biases between the model estimates and satellite observations. These patterns are assumed to remain valid until a time ttarget in the near future for which the forecast will be made.
Ultimately, ground-based measurement data (US EPA) are used to establish a relationship between the model and satellite-derived spatial patterns and observed surface concentration levels during the calibration period Tcalibration leading up to the current time tcurrent. Relationships established for Tcalibration are extrapolated forward in time to support predictions of surface concentrations at ttarget. Finally, these predictions are updated using the latest ground measurement data.
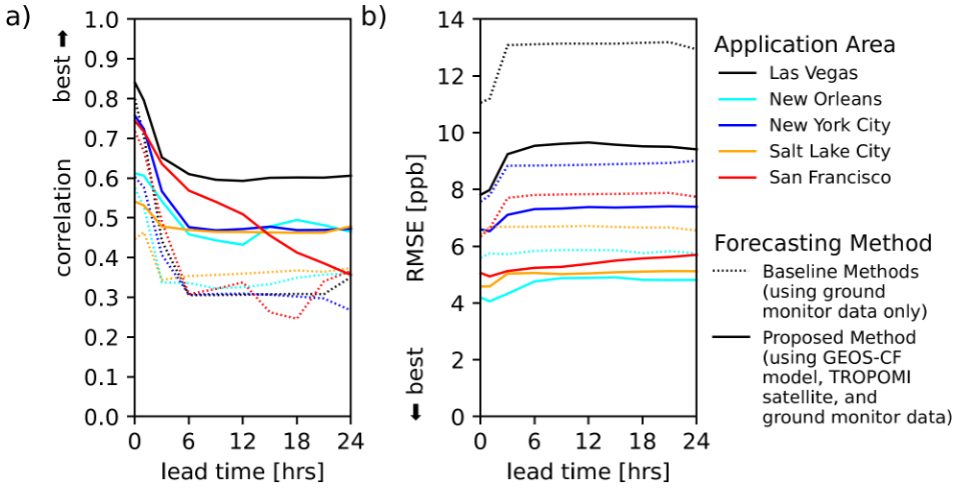
This proposed method is tested by forecasting surface NO2 up to 24 hours in advance across five US cities (Las Vegas, New Orleans, New York City, Salt Lake City, and San Francisco) in September 2019. The method’s performance is compared with that of two baseline approaches, namely “persistence” and “climatology” (Malings et al. 2021), which make use of surface monitoring data only. In all five cases, the proposed method performed better than the baselines during cross-validation against withheld ground monitoring site data, as indicated in Figure 2. These improvements are due both to an increase in spatial resolution, obtained by incorporating the TROPOMI satellite information, and to the adjustments made to improve forecasts by comparing these to the most recent ground-based measurement data. The drops in performance observed between 0 and about 3 hours lead time occur since the most recent ground-based measurements become increasingly out-of-date. These measurements provide both the baselines and proposed methods with information on transient and/or localized air quality events, which become less relevant as the forecast lead time increases. Also, note that the performance is not expected to be perfect (correlation of 1, RMSE of 0) since performance is evaluated at specific EPA ground monitoring sites via cross-validation, in which information from the ground site where performance is being evaluated is not included as an input to the method being evaluated.
The proposed method, which uses a combination of globally available satellite and model data together with some local measurements, can be applied to different types of air pollution in all regions of the world, thereby improving our understanding of air pollution globally. When available, data from geostationary satellites for air quality monitoring missions, e.g., Tropospheric Emissions: Monitoring of POllution (TEMPO) over North America, can be incorporated into the proposed method, allowing for time-of-day-specific satellite data patterns to be used (instead of the single “typical pattern” used for all times of day here). Incorporating the additional ground data sources available through low-cost sensor networks is also a promising area for future work, allowing these relatively spatially dense measurements to further improve the performance of this proposed method.
Reference:
Malings, C., Knowland, K. E., Keller, C. A., & Cohn, S. E. (2021). Sub-city scale hourly air quality forecasting by combining models, satellite observations, and ground measurements. Earth and Space Science, 8, e2021EA001743. https://doi.org/10.1029/2021EA001743.