

Impact of a regional US drought on land and atmospheric carbon
Regional droughts affect the amount of carbon absorbed by the land biosphere and the amount of CO2 remaining in the atmosphere. Dry land conditions can also feedback on local and remote weather, which may further modify the carbon anomalies. This study quantifies the impact of a regional US drought on land and atmospheric carbon, using GMAO’s Global Earth Observing System (GEOS) Earth System Model that couples the carbon, water, and energy cycles across the land and the atmosphere.
In our simulations, we impose an idealized spring drought for three months (April-June) over the lower Mississippi River Valley (~500,000 km2), followed by a 3-month recovery period (July-September). The result shows that the drought reduces the vegetation productivity (e.g., gross primary production by up to -23%) and the land’s uptake of atmospheric CO2 in the drought area. The productivities in some remote areas adjacent to the imposed drought are also affected through induced changes in remote meteorology. Increases in atmospheric CO2 extend over an area larger than the imposed drought due to atmospheric transport, but the changes are small and near the measurement uncertainty of current greenhouse gas observing satellites. Hatched in the graphic indicate the anomalies that are statistically significant with p < 0.05.
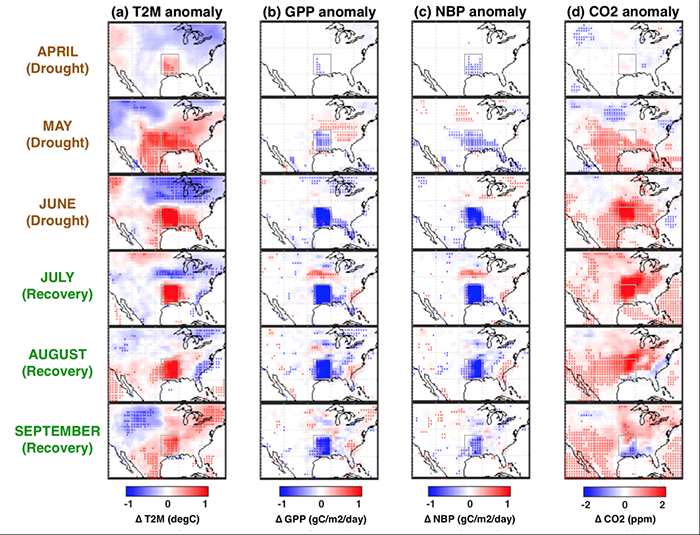
In this graphic, monthly anomalies caused by the imposed drought are shown in four columns: (a) 2-meter air temperature, (b) gross primary production, (c) net biosphere production, and (d) surface CO2 in the lowest atmospheric model layer (about 50 m). Hatched areas indicate the anomalies that are statistically significant.
» Click for PDF [4:3 aspect ratio] «
This study provides a better understanding of the processes that control carbon anomalies induced by a regional drought and how they manifest themselves in satellite observations (e.g., OCO-2, OCO-3, and the upcoming GeoCarb).
Reference:
Lee, E., F. Zeng, R. D. Koster, L. E. Ott, S. P. Mahanama, B. Weir, B. Poulter, and T. Oda. 2020. "Impact of a Regional US Drought on Land and Atmospheric Carbon.", J. Geophys. Res.: Biogeosci., 125 (8), doi:10.1029/2019jg005599