

SMAP Observations Can Improve Near-Surface Humidity and Temperature in GEOS Weather Analysis
Introduction
Soil moisture plays an important role in the Earth’s energy, water, and carbon cycles through its control on photosynthesis and evapotranspiration, which in turn impact atmospheric boundary layer dynamics. The accurate modeling of soil moisture is therefore critical for improving weather and seasonal climate predictions.
This study demonstrates that the assimilation of brightness temperature (Tb) observations from the NASA Soil Moisture Active Passive (SMAP) mission into the Goddard Earth Observing System (GEOS) weather analysis can improve estimates of soil moisture and, consequently, near-surface atmospheric conditions, compared to a system without SMAP assimilation.
Method
SMAP Tb observations were assimilated into a prototype weakly-coupled GEOS land-atmosphere data assimilation system during June-August 2017, along with the standard suite of atmospheric observations. For reference, a control experiment with atmospheric data assimilation but without SMAP assimilation was also conducted.
Results
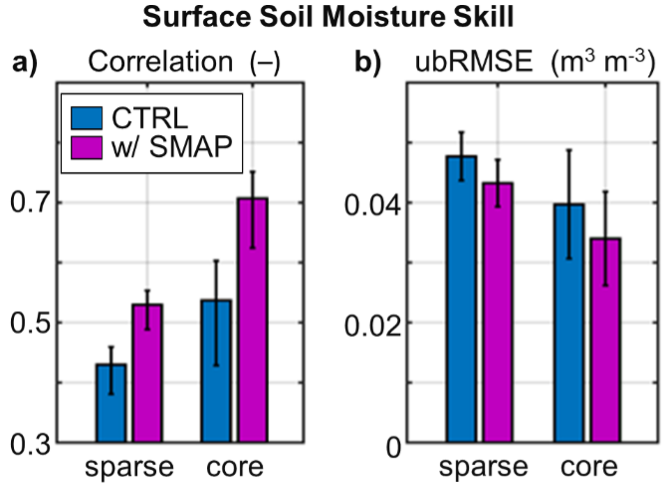
The SMAP Tb assimilation improves the skill of soil moisture in the GEOS weather analysis system compared to the control experiment (Fig. 1).
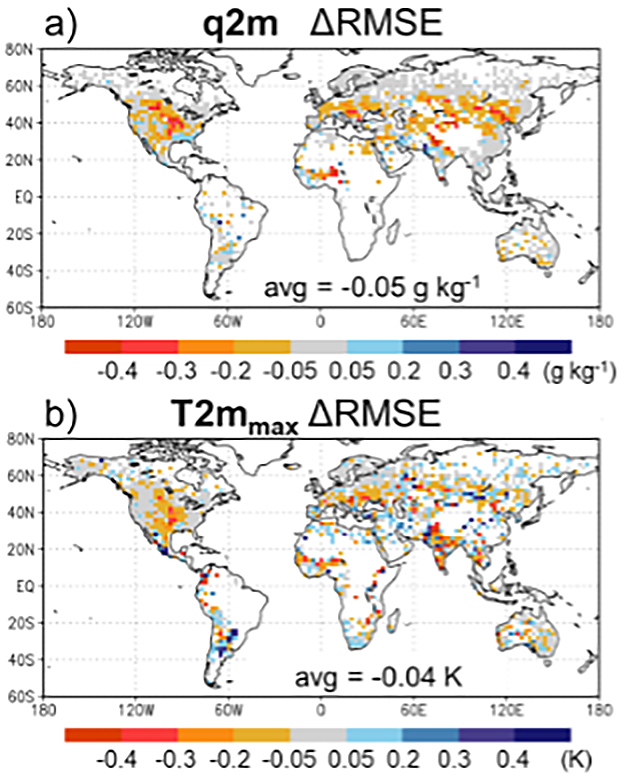
Through land-atmosphere interactions, the improved soil moisture leads to better screen-level air specific humidity (q2m) and daily maximum temperature (T2mmax), with root-mean-square error (RMSE) reduced by up to 0.4 g/kg and 0.3 °K, respectively, in some regions (Fig. 2).
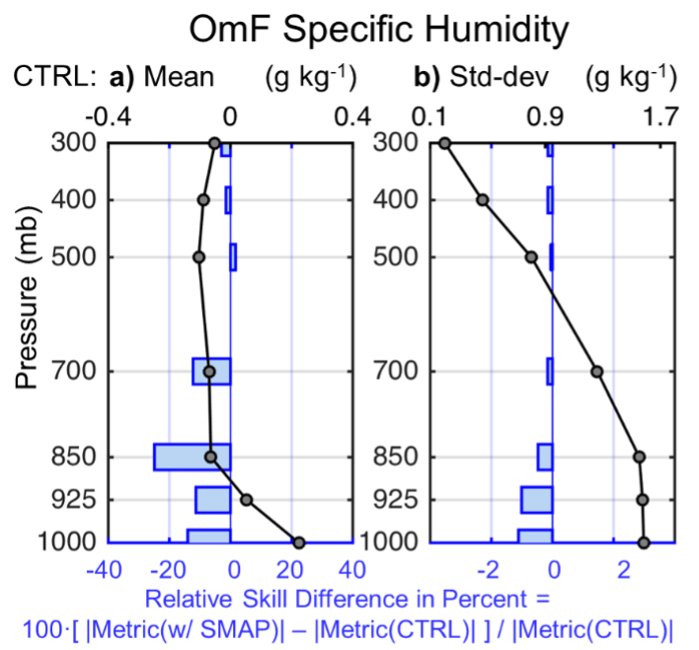
The improvement in the specific humidity from SMAP Tb assimilation extends into the lower troposphere (Fig. 3).
Taken together, the above results demonstrate the strong potential of SMAP Tb observations for improving global operational weather analysis and forecasting systems.
Reference:
Reichle, R. H., S. Q. Zhang, Q. Liu, C. S. Draper, J. Kolassa, and R. Todling (2021), Assimilation of SMAP Brightness Temperature Observations in the GEOS Land-Atmosphere Data Assimilation System, IEEE Journal of Selected Topics in Applied Earth Observations and Remote Sensing, in press, doi:10.1109/JSTARS.2021.3118595.