

The Abnormally Hot June 2021 in the Western U.S.: A MERRA-2 perspective
An extreme heat wave occurred over much of the western US and southwestern Canada in late June 2021. We use daily and monthly near-surface temperature from MERRA-2 Reanalysis to compare the hot conditions of this year with the previous 40 years, particularly over the northwestern US that was severely affected.
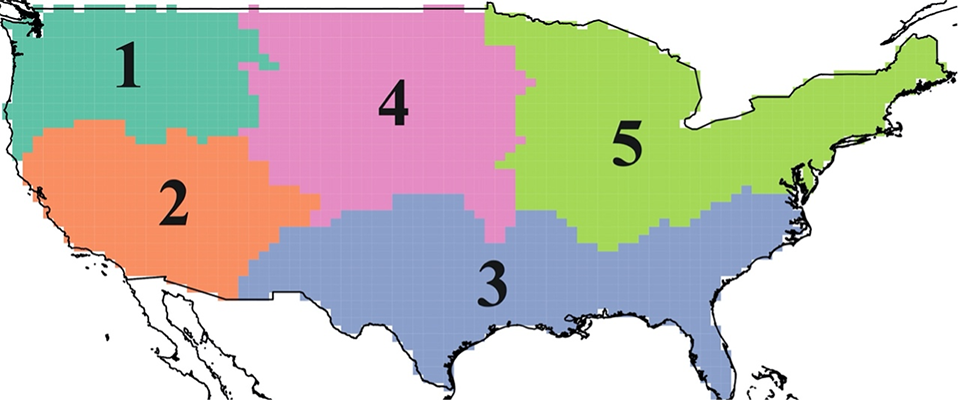
To investigate temporal characteristics of regional mean temperature, the contiguous US was objectively divided into homogeneous regions (Figure 1), using the HiClimR package (Badr et al. 2015). The regions were determined based on similarity in interannual variability of June temperature (1981-2020) from MERRA-2. The northwestern U.S.—identified as Region 1—is spatially coherent, therefore its areal average temperature was used to represent the entire region.
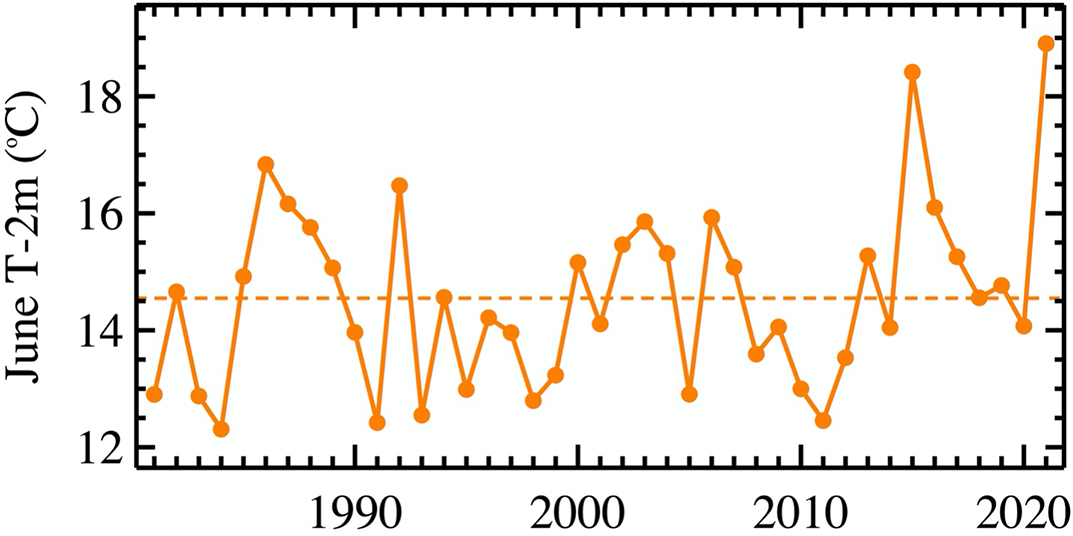
The monthly regional average temperature of 2021 stands out as the hottest June, followed by 2015 (Figure 2). It is interesting that both years have the highest temperature increase from the previous year in MERRA-2 record for the region.
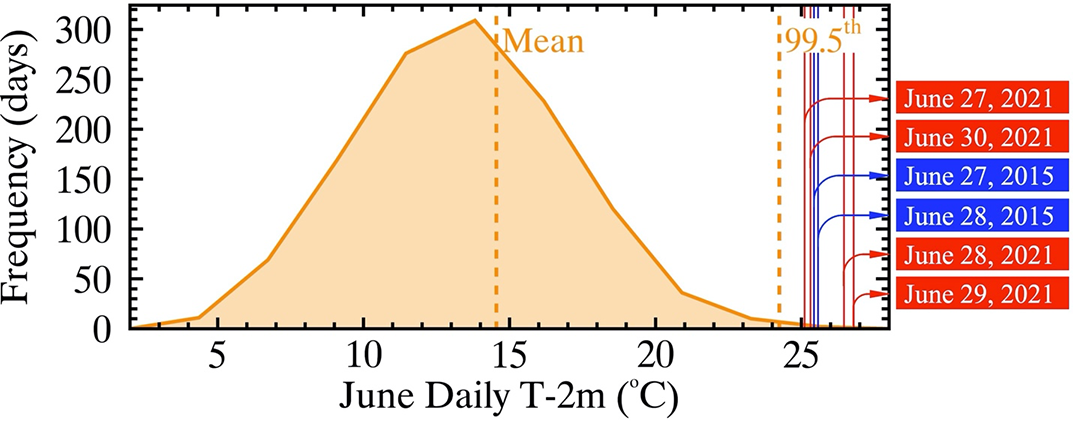
The frequency distribution of the daily regional temperature shows that the hottest day happened on June 29, 2021, over the northwestern region. The mean temperature on that day was 26.8 7deg;C corresponding to a z-score of 3.41. Of the six days warmer than the 99.5th percentile, four occurred in 2021 (red lines) and two in 2015 (blue lines).
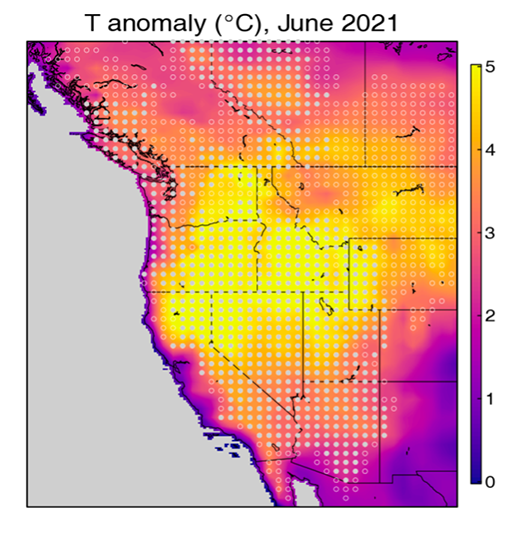
The heat anomalies spanned the entire western U.S. and southwestern Canada (Figure 4). Large areas of the Northwestern USA, as well as parts of western Canada, experienced temperatures that exceeded the 99th percentile of the statistical distribution computed from MERRA-2 analyses for 1980-2020.
Reference:
Badr, H.S., Zaitchik, B.F. and Dezfuli, A.K., 2015. A tool for hierarchical climate regionalization. Earth Science Informatics, 8(4), pp.949-958.
MERRA-2 file collection:
For monthly temperature:
https://doi.org/10.5067/KVIMOMCUO83U
For daily temperature:
https://doi.org/10.5067/9SC1VNTWGWV3