

Regional Impacts of COVID-19 on Carbon Dioxide Detected Worldwide from Space
Monitoring of atmospheric carbon dioxide (CO2) concentrations is critically important for combating climate change. Surface concentrations have been measured for decades at remote locations, but these data do not provide sufficient spatial and temporal coverage to quantify regional changes in human emissions. The Orbiting Carbon Observatory 2 (OCO-2), launched in 2014, is NASA’s first mission designed to collect data with sufficient accuracy to improve source and sink attribution. However, the primary focus of OCO-2 were natural sources and sinks from the land and ocean, not human emissions. Further complicating matters, the infrared sensors of OCO-2 require clear-sky, sunlit conditions for accurate retrievals of the dry-air column averaged CO2 mixing ratios (XCO2), which can leave large gaps between swaths and over key regions and ecosystems. In this work, we demonstrate that high-quality, gap-filled maps of XCO2 produced by assimilating OCO-2 XCO2 data into an Earth system model can provide a new and powerful tool for monitoring regional changes in human emissions using the Coronavirus Diseases 2019 (COVID-19) period as an example (Weir et al., 2021).
During COVID-19, decreases in human emissions of short-lived pollutants like nitrogen dioxide (NO2) were first observed over China in February 2020. As human activity declined to slow the spread of the virus, emissions from vehicles were sharply reduced in many areas. Because NO2 only remains in the atmosphere for a matter of hours, these reduced emissions translated into decreases in NO2 concentrations in urban areas that were observed from space from several satellites. Despite these clear and early indications of human emission reductions, quantifying the impact on CO2 concentrations was much more challenging. Unlike NO2, CO2 remains in the atmosphere for decades to centuries. This means that subtle decreases in emissions are carried far downwind of the regions where activity changes may occur. They are also strongly impacted by weather patterns and land and ocean carbon sinks, which vary from year-to-year. In addition, independent estimates of country-scale CO2 emissions based on near-real-time activity data suggested that annual decreases were only 4–10%, because a larger portion of human CO2 emissions comes from power generation, a sector less impacted by activity reduction.
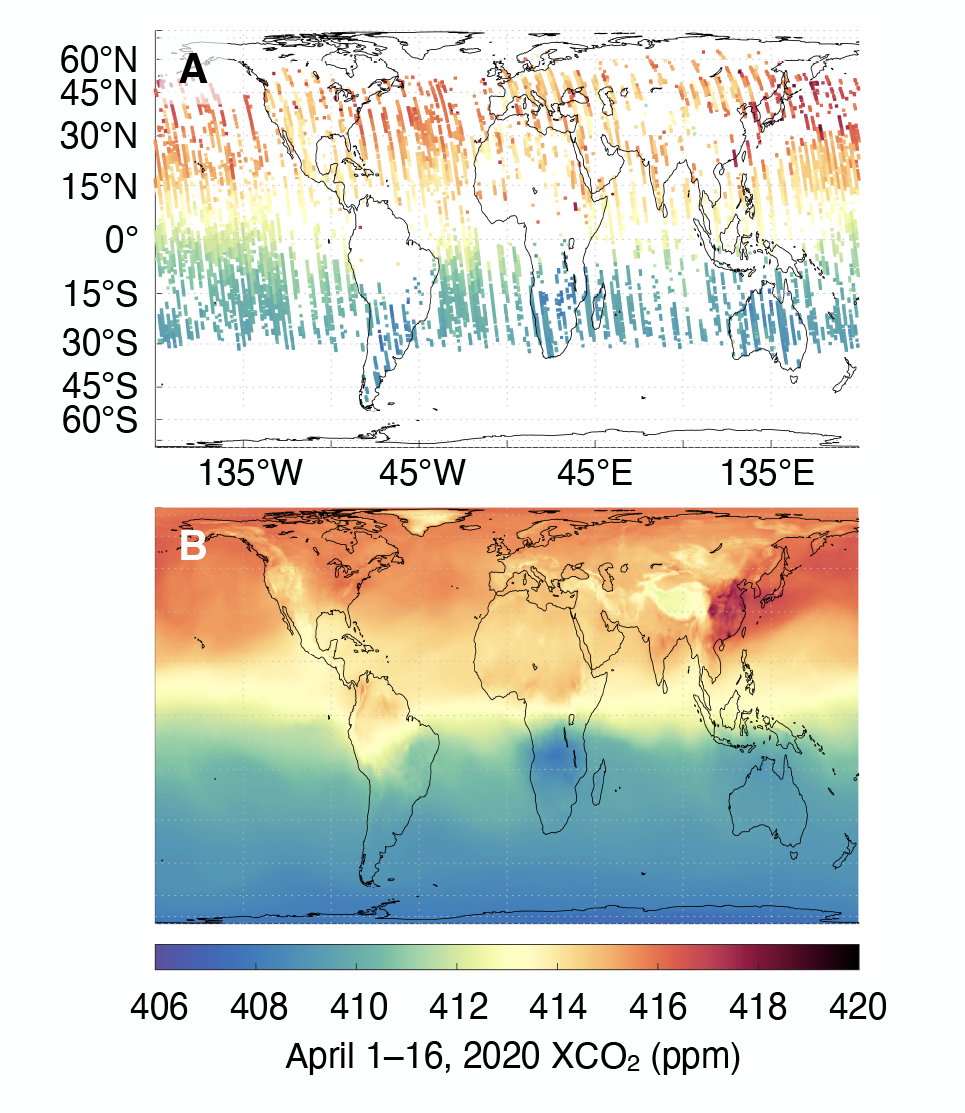
In order to quantify emissions-driven changes in CO2 concentration during COVID-19, OCO-2 XCO2 retrievals were assimilated into the Goddard Earth Observing System (GEOS) Constituent Data Assimilation system (CoDAS). CoDAS uses information about surface source distributions and weather patterns from a variety of satellites to provide high-quality information when direct OCO-2 observations are unavailable (Figure 1). This study also developed a novel technique to remove the imprint of circulation patterns that involved running parallel reference GEOS general circulation model (GCM) simulations that used the same surface source and sink information used in CoDAS but did not include assimilation of OCO-2 data. CO2 anomalies that compare 2020 to a multi-year mean were calculated from both the CoDAS and GCM runs. The GCM anomaly represents the circulation-driven component of the CO2 anomaly, which can be subtracted from the CoDAS anomaly to estimate the component of CO2 difference due to emissions.
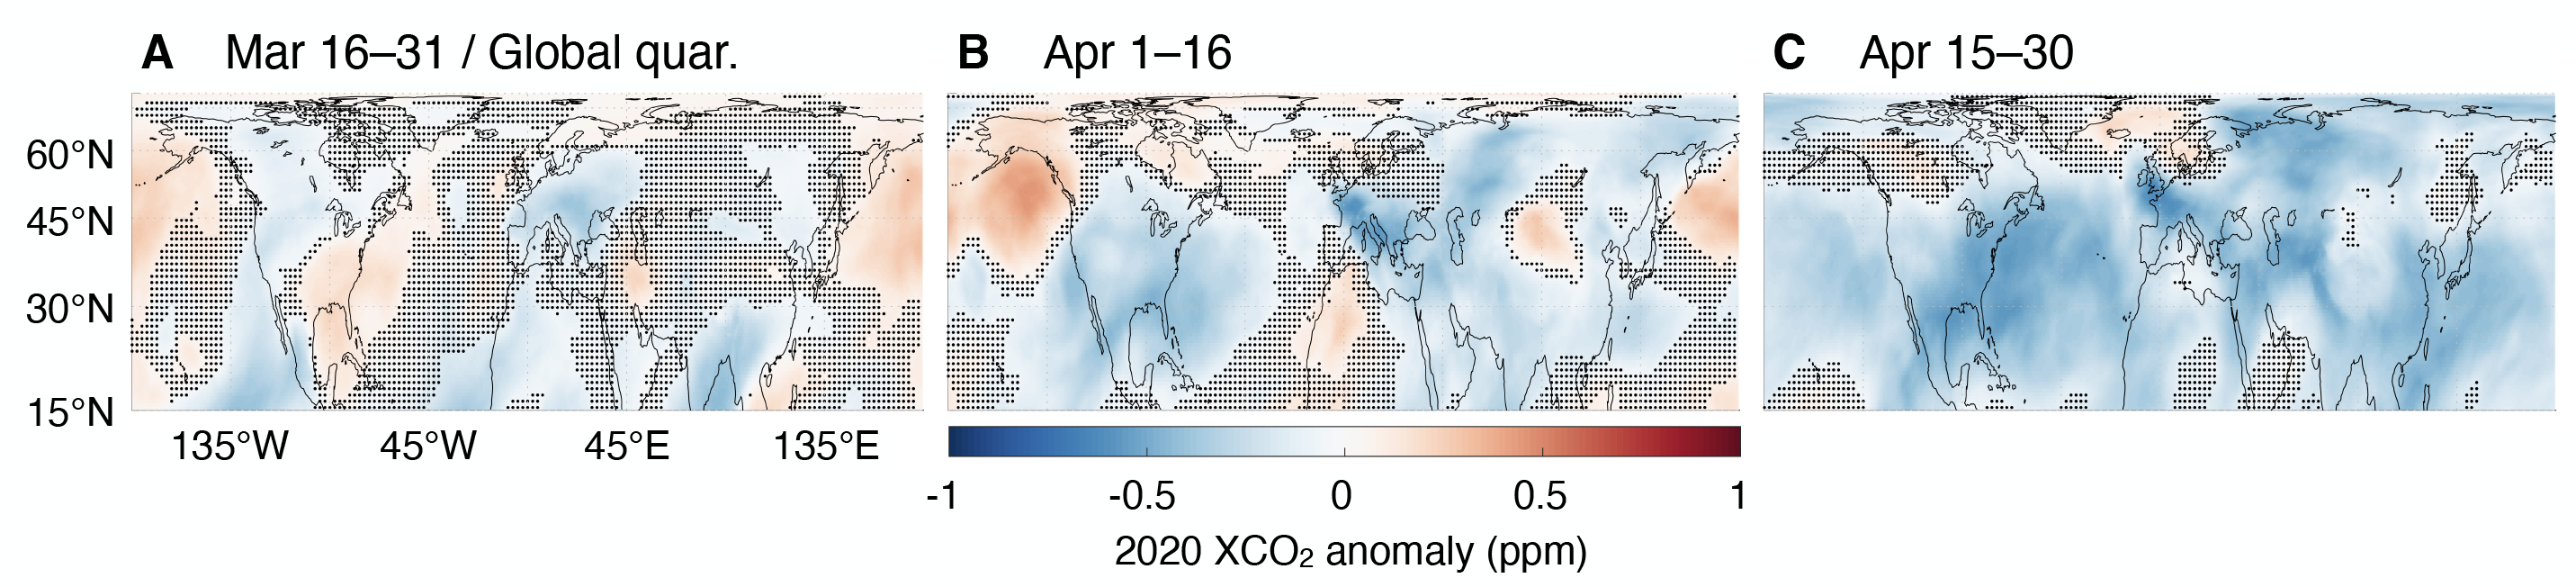
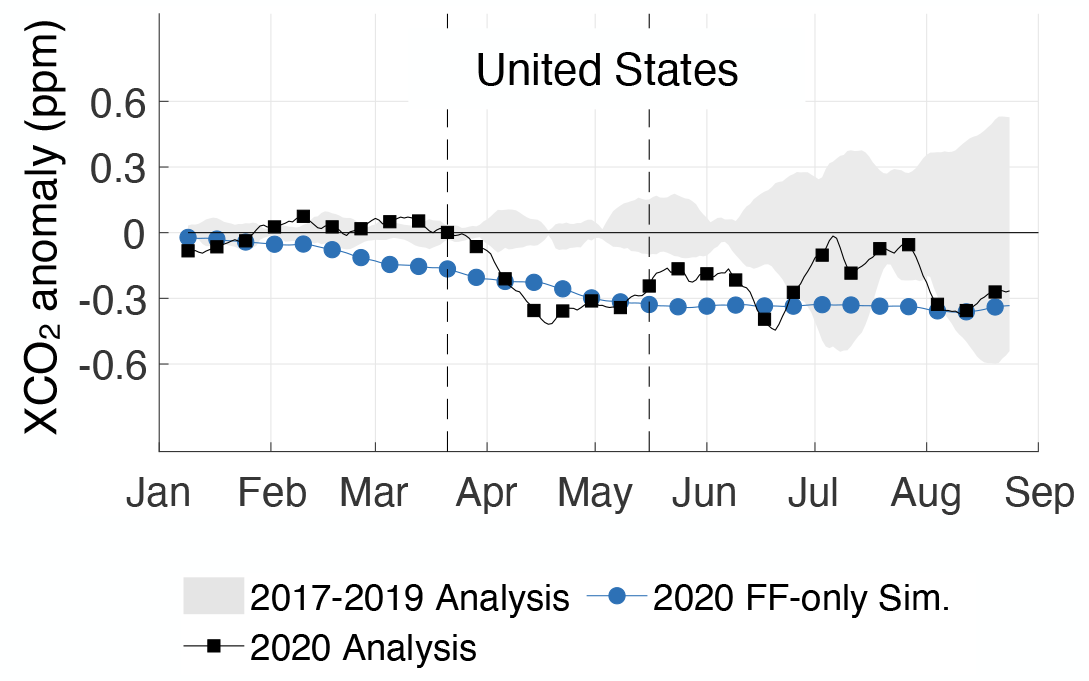
These emission-driven anomaly maps track the change in CO2 concentration before and during lockdowns in early spring and also record the return to more normal conditions late in the year (Figure 2). These data can also be compared with independent estimates of emissions decreases. Groups such as CarbonMonitor (Liu et al., 2020; https://carbonmonitor.org) provide low latency estimates of changes in human emissions by integrating large quantities of activity data that provide information on power generation, industrial production, mobility, and fuel consumption. These data are potentially valuable in helping scientists and decisionmakers monitor recent changes in emissions but are subject to larger uncertainty than more traditional emissions estimates that are often subject to latencies of a years or more. Figure 3 compares a GEOS simulation that imposed emissions estimates based on CarbonMonitor with the emission-driven anomalies described above over the United States. OCO-2 derived emissions decreases are similar in magnitude to those from carbon monitor in early spring when the northern hemisphere biosphere is not active with both showing a decrease in XCO2. In later spring and summer, when the influence of the northern hemisphere terrestrial biosphere is largest, tracking the signal of human emissions decreases becomes more difficult.
Though emission decreases during COVID-19 are not a perfect analogue to emission decreases that would be needed to limit impacts of climate change, this period provided an important test of the capability of current generation carbon monitoring systems to detect changes in human emissions. These results demonstrate that the combination of space-based data and advanced data assimilation systems can provide valuable, low latency information in support of a variety of applications, though weather and the terrestrial biosphere substantially complicate such efforts. Future satellites like NASA’s GeoCarb that are designed to provide denser spatial coverage will support detection of human emissions changes at finer spatial scales.
References:
Z. Liu et al., Near-real-time monitoring of global CO2 emissions reveals the effects of the COVID-19 pandemic. Nat. Commun. 11, 5172, (2020). https://doi.org/10.1038/s41467-020-18922-7
B. Weir, D. Crisp, C. W. O’Dell, S. Basu, A. Chatterjee, J. Kolassa, T. Oda, S. Pawson, B. Poulter, Z. Zhang, P. Ciais, S. J. Davis, Z. Liu, and L. E. Ott, Regional impacts of COVID-19 on carbon dioxide detected worldwide from space. Science Adv. 7, eabf9415 (2021). https://doi.org/10.1126/sciadv.abf9415