

Declines in Atmospheric Pollution During the COVID-19 Lockdown Are Consistent With Contraction in Economic Output
Nitrogen oxides (NOx=NO+NO2) are an important air pollutant emitted during the combustion of fossil fuel for industry, transport and domestic activities [Streets et al., 2013, Duncan et al., 2016]. Because of these sources and its short lifetime, concentrations of nitrogen oxides respond rapidly to changes in economic activities. This is reflected in the sharp decline in NO2 concentration observed in the wake of the COVID-19 pandemic (see for example the reductions in NO2 observed from the NASA Ozone Monitoring Instrument (OMI) satellite (https://earthdata.nasa.gov/covid19/indicators/no2, Liu et al., 2020).
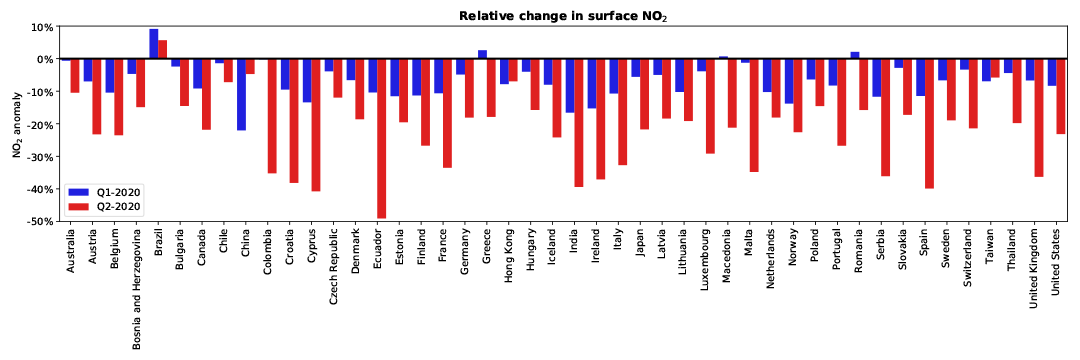
However, NO2 concentrations also change due to the weather and season and these factors need to be accounted for before drawing conclusions about causality. One approach is to combine near real-time NASA model simulations with surface observations made by air quality monitoring stations. A machine learning algorithm can be used to understand the historical relationship between observed local air pollution concentrations and the model and this can be used to calculate the concentration of NO2 that would have been expected had COVID-19 not occurred (Keller et al., 2020). Applying this to 4,778 air quality monitoring sites in 46 countries shows that NO2 concentrations declined by up to 45% during the second quarter of 2020 relative to the business as usual scenario (Figure 1).
Given the major sources of NO2, a close relationship between the impact of COVID-19 on NO2 concentration and economic activity is to be expected. Figure 2 shows the change in detrended national gross domestic product (GDP, obtained from https://tradingeconomics.com/) compared to the change in NO2 concentration shown in Figure 1 averaged over the 1st or 2nd quarter of 2020.
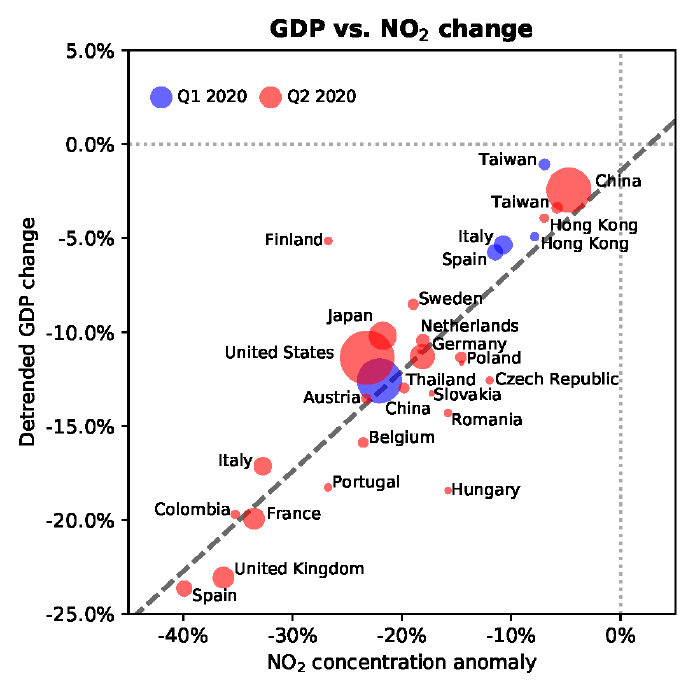
Only countries that were significantly impacted by COVID-19 for either of those quarters and with available GDP data are shown. To allow for better GDP comparisons against surface NO2 (and also between countries), the nominal GDP value of each country has been detrended based on least squares linear regression of the 2017-2019 GDP growth rates. The thus obtained NO2 to GDP relationship suggests that there is a strong, linear relationship between the change in the GDP and change in the country level NO2 concentration, with a 10% percentage decrease in NO2 concentrations corresponding to an average output contraction of 5.3% relative to the country’s baseline GDP. Detailed results for all analyzed countries are summarized in Table 1.
| Period | Country | NO2 anomaly | Reported GDP | Detrended GDP | Predicted GDP |
|---|---|---|---|---|---|
| Q1-2020 | China | -22 | -6.8 | -12.6 | -13.2 |
| Q1-2020 | Hong Kong | -7.8 | -8.9 | -4.9 | -5.6 |
| Q1-2020 | Italy | -10.7 | -5.4 | -5.4 | -7.1 |
| Q1-2020 | Spain | -11.5 | -4.1 | -5.8 | -7.5 |
| Q1-2020 | Taiwan | -7 | 1.6 | -1.1 | -5.1 |
| Q2-2020 | Australia | -10.5 | n/a | n/a | -7 |
| Q2-2020 | Austria | -23.3 | -12.8 | -13.5 | -13.8 |
| Q2-2020 | Belgium | -23.5 | -14.5 | -15.9 | -14 |
| Q2-2020 | Bosnia and Herzegovina | -14.9 | n/a | n/a | -9.4 |
| Q2-2020 | Brazil | 5.7 | n/a | n/a | 1.6 |
| Q2-2020 | Bulgaria | -14.5 | -8.2 | -11.6 | -9.2 |
| Q2-2020 | Canada | -21.8 | n/a | n/a | -13.1 |
| Q2-2020 | Chile | -7.2 | n/a | n/a | -5.3 |
| Q2-2020 | China | -4.7 | 3.2 | -2.4 | -3.9 |
| Q2-2020 | Colombia | -35.2 | -15.7 | -19.7 | -20.2 |
| Q2-2020 | Croatia | -38.2 | n/a | n/a | -21.8 |
| Q2-2020 | Cyprus | -40.8 | -11.9 | -14.5 | -23.1 |
| Q2-2020 | Czech Republic | -12 | -10.7 | -12.6 | -7.8 |
| Q2-2020 | Denmark | -18.6 | n/a | n/a | -11.3 |
| Q2-2020 | Ecuador | -49.1 | n/a | n/a | -27.6 |
| Q2-2020 | Estonia | -19.6 | n/a | n/a | -11.8 |
| Q2-2020 | Finland | -26.7 | -4.9 | -5.1 | -15.7 |
| Q2-2020 | France | -33.5 | -19 | -19.9 | -19.3 |
| Q2-2020 | Germany | -18.1 | -11.7 | -11.3 | -11.1 |
| Q2-2020 | Greece | -17.9 | n/a | n/a | -11 |
| Q2-2020 | Hong Kong | -7 | -9 | -3.9 | -5.1 |
| Q2-2020 | Hungary | -15.8 | -13.6 | -18.4 | -9.8 |
| Q2-2020 | Iceland | -24.2 | n/a | n/a | -14.3 |
| Q2-2020 | India | -39.4 | n/a | n/a | -22.4 |
| Q2-2020 | Ireland | -37.1 | n/a | n/a | -21.2 |
| Q2-2020 | Italy | -32.7 | -17.3 | -17.1 | -18.9 |
| Q2-2020 | Japan | -21.7 | -9.9 | -10.2 | -13 |
| Q2-2020 | Latvia | -18.4 | -9.8 | -11 | -11.2 |
| Q2-2020 | Lithuania | -19.2 | -3.8 | -7.8 | -11.6 |
| Q2-2020 | Luxembourg | -29.2 | n/a | n/a | -17 |
| Q2-2020 | Macedonia | -21.2 | n/a | n/a | -12.7 |
| Q2-2020 | Malta | -34.8 | n/a | n/a | -20 |
| Q2-2020 | Netherlands | -18.1 | -9.3 | -10.5 | -11.1 |
| Q2-2020 | Norway | -22.6 | n/a | n/a | -13.5 |
| Q2-2020 | Poland | -14.6 | -8.2 | -11.3 | -9.2 |
| Q2-2020 | Portugal | -26.7 | -16.5 | -18.3 | -15.7 |
| Q2-2020 | Romania | -15.8 | -10.5 | -14.3 | -9.8 |
| Q2-2020 | Serbia | -36.1 | n/a | n/a | -20.7 |
| Q2-2020 | Slovakia | -17.3 | -12.1 | -13.3 | -10.6 |
| Q2-2020 | Spain | -39.9 | -22.1 | -23.6 | -22.7 |
| Q2-2020 | Sweden | -19 | -8.2 | -8.5 | -11.5 |
| Q2-2020 | Switzerland | -21.4 | n/a | n/a | -12.8 |
| Q2-2020 | Taiwan | -5.8 | -0.7 | -3.4 | -4.5 |
| Q2-2020 | Thailand | -19.8 | -12.2 | -13 | -12 |
| Q2-2020 | United Kingdom | -36.3 | -21.7 | -23.1 | -20.8 |
| Q2-2020 | United States | -23.2 | -9.5 | -11.4 | -13.8 |
These results highlight the strong relationship between atmospheric NO2 and human economic activity, indicating that a sustainable reduction in NO2 pollution can only be achieved if this strong link between NOx emissions and economic output can be broken.
See the related article: "NASA Model Reveals How Much COVID-related Pollution Levels Deviated from the Norm".
References:
Duncan, B. N., L. N. Lamsal, A. M. Thompson, Y. Yoshida, Z. Lu, D. G. Streets, M. M. Hurwitz, and K. E. Pickering, 2016: A space-based, high-resolution view of notable changes in urban NOx pollution around the world (2005–2014). J. Geophys. Res., 121, 976-996. DOI: 10.1002/2015JD024121
Keller, C. A., M. J. Evans, K. E. Knowland, C. A. Hasenkopf, S. Modekurty, R. A. Lucchesi, T. Oda, B. B. Franca, F. C. Mandarino, M. V. Díaz Suárez, R. G. Ryan, L. H. Fakes and S. Pawson, 2020: Global Impact of COVID-19 Restrictions on the Atmospheric Concentrations of Nitrogen Dioxide and Ozone, arXiv:2008.01127v1, https://arxiv.org/abs/2008.01127v1.
Liu F., et al., 2020: Abrupt decline in tropospheric nitrogen dioxide over China after the outbreak of COVID-19. Science Advances, DOI: 10.1126/sciadv.abc2992.
Streets, D. G., Canty T., Carmichael, G. R. , de Foy, B. Dickerson, R. R, Duncan, B. N., Edwards, D. P. , Haynes, J. A., Henze, D. K., Houyoux, M. R., Jacob, D. J., Krotkov, N. A., Lamsal, L. N., Liu, Y., Lu, Z., Martin, R. V., Pfister, G. G., Pinder, R. W., Salawitch, R. J., and K. J. Wecht, 2013: Emissions estimation from satellite retrievals: A review of current capability. Atmospheric Environment, 77, 1011-1042, https://doi.org/10.1016/j.atmosenv.2013.05.051.