
High Resolution GEOS Forecasts of Super Typhoon Hagibis
The intense tropical cyclone, Hagibis, rapidly intensified in the western Pacific Ocean reaching super typhoon status on 07 October 2019. The Goddard Earth Observing System (GEOS) model currently running in real-time at 12km horizontal resolution with 72 vertical levels assimilating global observations to produce initial states and forecasts of global weather is able to capture much of the large-scale features of intense storms like Hagibis.
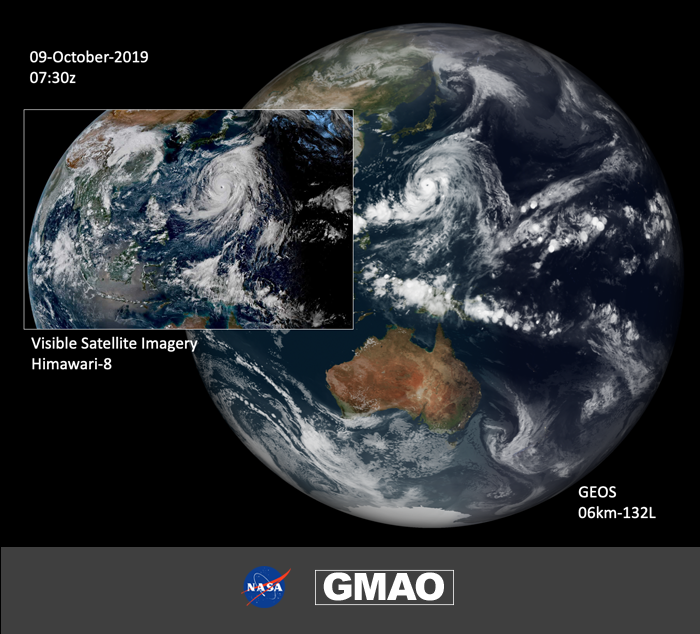
An experimental version of GEOS running with nearly 8× as many grid volumes at 6km horizontal resolution with 132 vertical levels and including non-hydrostatic dynamical effects, advanced convection, and cloud physics processes provides an improved representation of the mesoscale features of Hagibis.
The animation below shows the predicted cloud fields (displayed as infrared longwave simulated brightness temperatures) from GEOS-FP (12km 72L, left) compared with the experimental GEOS model (6km 132L, right). Throughout the animation, the improved physical representation of typhoon Hagibis can be seen from the better defined eye and the enhanced cloud properties within the bands of convection extending through the outflow of the typhoon.
Full Resolution MP4 animation: https://gmao.gsfc.nasa.gov/research/science_snapshots/anim/typhoon_Hagibis.mp4