
Length Scales of Hydrological Variability as Inferred from SMAP Soil Moisture Retrievals
If you measure daily rainfall over several years at two locations separated by a kilometer, chances are high that the time series of rainfall measurements at these two locations will be almost identical, as both would see approximately the same sequence of rainstorms and dry periods. If the locations were ten or maybe even 50 kilometers apart, the time series could still be quite similar, but if they were 500 km apart, the sites would probably see different storms at different times, and the agreement would be quite low. How far away from a given site must one travel for the rainfall experienced to lose, say, half of its “similarity” to the rainfall at the original site? Such a length scale can be determined through statistical analysis of the rainfall data. Length scales can similarly be defined and computed for other hydrological fields as well – fields such as soil moisture, evapotranspiration, and streamflow. In fact, the length scales for all of these hydrological fields are tied together, given that variations in precipitation largely drive variations in soil moisture, which in turn help drive variations in the other fields
Such length scales can be considered important overall descriptors of hydrological variability. Quantifying them across the globe with surface measurements, however, is essentially impossible due to the shortcomings of existing surface networks, with missing data in many large continental areas. For the global estimation of length scales, we must turn to satellite-based data. A new NASA dataset offers particular advantages in this regard. Level 2 estimates of near-surface soil moisture (representing the top several centimeters of soil) from the NASA Soil Moisture Active Passive, or SMAP, mission cover the globe at a resolution of about 36 km and a return time of a few days. These data, covering April 2015 through present, have been shown in past studies (Koster et al. 2016, 2018; Purdy et al. 2018) to be tied strongly to independent measurements of precipitation, evapotranspiration, and streamflow. As a result, soil moisture length scales estimated from SMAP data should be tied strongly to the length scales of these other fields – the SMAP-based length scales should have general hydrological relevance.
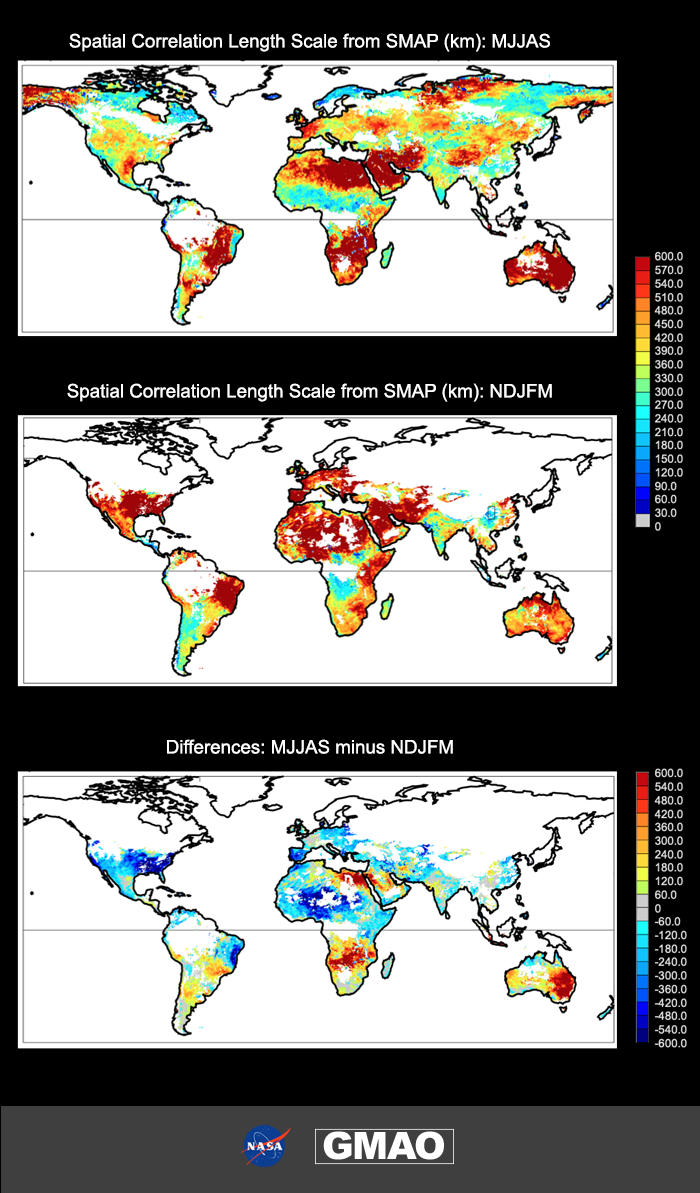
This figure shows global maps of length scales estimated from SMAP data for two seasons (May through September and November through March). Here, the length scale plotted at a given point represents, in effect, the average distance one must travel from that point to reach soil moisture that varies with that at the original location with a correlation of 1/e. In the neighborhood of Texas, for example, locations 500 km apart from each other show some similarity in the variations of their soil moisture state and thus in their hydrological fluxes during summer, while in the neighborhood of Alabama, hydrological variations at locations 500 km apart are essentially independent. Length scales in the US increase dramatically during winter, which makes sense given that summertime rainfall there (which, again, drives the soil moisture) is characterized by thunderstorms, whereas wintertime storms there are more spatially extensive. The large length scales (> 500 km) in the Amazon during May-September are consistent with continental-scale El Nino impacts. Low length scales (< 300 km) are seen in the Sahel for May-September, again reflecting the importance of convection in that region.
SMAP data provide a unique global picture of this important facet of hydrological variability, a picture that is arguably unattainable with other datasets. Among other applications, the above maps can serve as targets for climate model validation.
The length scales of hydrological variability have numerous potential impacts; preliminary studies, for example, suggest that they have direct bearing on the magnitudes of streamflow extremes. They have relevance to the interpretation of existing measurements and to climate variability in general, and, properly quantified, they can serve as targets for climate model validation. SMAP data provide a robust means of quantifying, across the globe, these fundamental physical descriptors of hydrological processes.
References:
Koster, R. D., L. Brocca, W. T. Crow, M. S. Burkin, and G. J. M. De Lannoy (2016a), Precipitation estimation using L-band and C-band soil moisture retrievals, Water Resources Res, 52, 7213-7225, doi:10.1002/2016wr019024.
Koster, R. D., R. H. Reichle, S. D. Schubert, and S. P. Mahanama, 2019. Length Scales of Hydrological Variability as Inferred from SMAP Soil Moisture Retrievals.J. Hydrometeorol., doi:10.1175/JHM-D-19-0070.1
Koster, R. D., W. T. Crow, R. H. Reichle, and S. P. Mahanama, 2018: Estimating basin-scale water budgets with SMAP soil moisture data. Water Resources Res., 54. doi.org/10.1029/2018WR022669
Purdy, A. J., and Co-Authors, 2018: SMAP soil moisture improves global evapotranspiration. Remote Sens. Env., 219, 1-14, doi:10.1016/j.rse.2018.09.023