
Assessing the Impact of Nearly 40 Years of Observations on Short-Range MERRA-2 Forecasts
It is currently routine for NWP systems to produce some estimate of how observations contribute to the performance of forecasts. At GMAO, such estimates are produced following an adjoint-based approach. Evaluation of the impact of observations on 24-hour forecasts typically requires 30- and 24-hour forecasts to be issued from two consecutive analyses. A split of the impacts into the sub-components of the observing system can be performed by evaluating the sensitivity of forecasts to changes in the observations. In the Tremolet (2018) extension of the Langland and Baker (2004) approach the sensitivity evaluation can be accomplished by a convolution of the adjoint of both the forecasting model and that of the analysis system. The GMAO atmospheric assimilation system carries along with it the necessary ingredients to generate adjoint-based observation impacts. Impact results from the near-real-time forward processing (FP) GMAO forecasts are available online. (https://gmao.gsfc.nasa.gov/forecasts/systems/fp/obs_impact/).
Systems such as FP represent the state-of-the-art in NWP and are frequently updated to incorporate latest improvements and developments in both the forecasting model and assimilation techniques. In such systems, it is difficult to distinguish the actual impact of observations from all other changes taking place in the system due to such updates. Reanalyses, like MERRA-2 (Gelaro et al. 2017), have the advantage of maintaining both the underlying forecast model and analysis/assimilation technique unchanged throughout their integration, with basically only the observing system changing over time.
The present work uses the adjoint of the GEOS general circulation model and the adjoint of the Gridpoint Statistical Interpolation analysis to evaluate observation impact for MERRA-2. For simplicity, only the impact on forecasts from 0000 UTC are evaluated, and only for the months of January and July. Twenty-four- and 30-hour forecasts have been generated for the near 40 year of MERRA-2 analyses, from 1980 to 2017; forecast errors are obtained by evaluating a largely-tropospheric (wet) total energy norm using MERRA-2 analysis for verification, and observation impacts are derived based on this error metric.
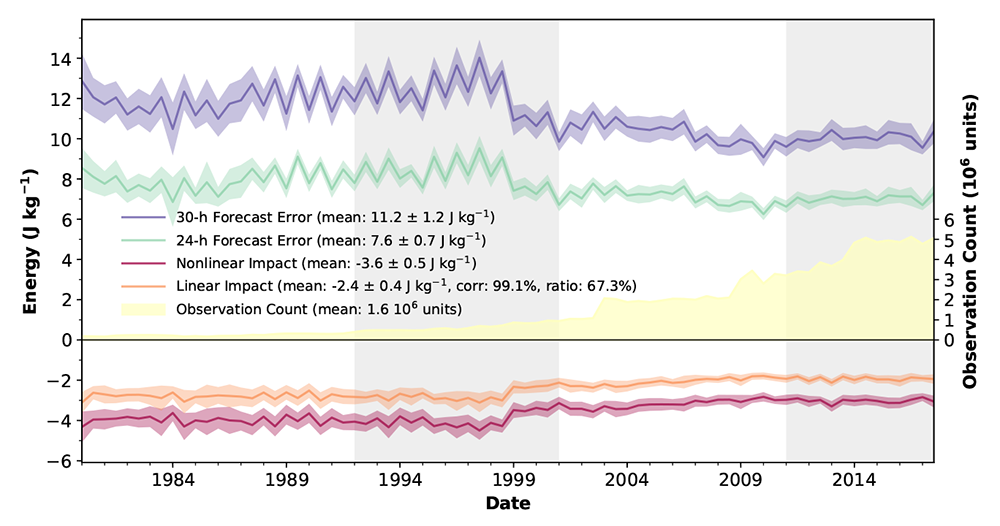
Figure 1
The first figure displays a six-month running mean time series of the monthly-mean 24- and 30-hour forecast errors (green and purple curves, respectively). The difference between these two curves (shown in red) is referred to as the forecast error reduction, or sometimes nonlinear impact, and it reflects the six-hour improvement in the quality of forecasts due to the assimilation of six hours of observations. The nonlinear impact is calculated in the three-dimensional grid of the total energy field and though it can be regionally partitioned, it cannot be broken up into sub-components of the observing system. The adjoint technique provides a proxy for the nonlinear impact, referred to as total impact (orange curve), which by construction can be split into individual contributions from various sub-components of the observing system. The forecast errors, and the nonlinear and linear impact curves, show a clear shift in their behavior as MERRA-2 goes from the late 1990's to the modern era (2000 and beyond). This shift is associated with the abrupt change in observation count taking place over the same period (yellow-shaded area). Not only more observations became available in these transition years but also better quality, higher vertical and horizontal coverage was introduced, especially from instruments placed onboard satellites. The resulting improvement in forecasts and first guesses is translated into an overall reduction (in absolute value) of the impact of observations.
The total linear impact of Fig. 1 can be broken up to show the contribution from various components of the observing system to forecast error reduction over the period of MERRA-2. Two particularly interesting partitions are shown in the two panels of Fig. 2. The figure shows fractional impact with respect to total impact, partitioned as satellite platforms carrying instruments with reports assimilated as brightness temperatures (top), and partitioned to show the various instruments carried on these platforms (bottom). Both panels display the same solid grey line showing that out of all observations assimilated, between 45% to 60% of 24-hour forecast error reduction is brought about by the assimilation of brightness temperatures. The end of the 1990s sees a rise in fractional impact largely due to a decrease in the availability of other (non brightness temperature) observations, and the introduction of the Advanced TIROS-N Operational Vertical Sounder on the NOAA-15 satellite. The launch of the NASA Aqua satellite with the introduction of the first hyperspectral infrared instrument (Atmospheric Infrared Sounder; AIRS), brings about massive amounts of observations with its fractional contribution taking away some of the fractional contribution from the Advanced Microwave Sounding Unit-A (AMSU-A; see Fig. 2b). Other hyperspectral IR instruments, namely Infrared Atmospheric Sounding Interferometer (IASI) and Cross-track Infrared Sounder (CrIS) are also introduced in more recent years; MERRA-2 keeps the fractional impact of hyperspectral IR instruments lined up with the impact from the early High-resolution Infrared Radiation Sounder (HIRS) instruments. It is believed that more should be gained from the hyperspectral instruments when inter-channel error correlations are taken into account in future GMAO reanalyses efforts.
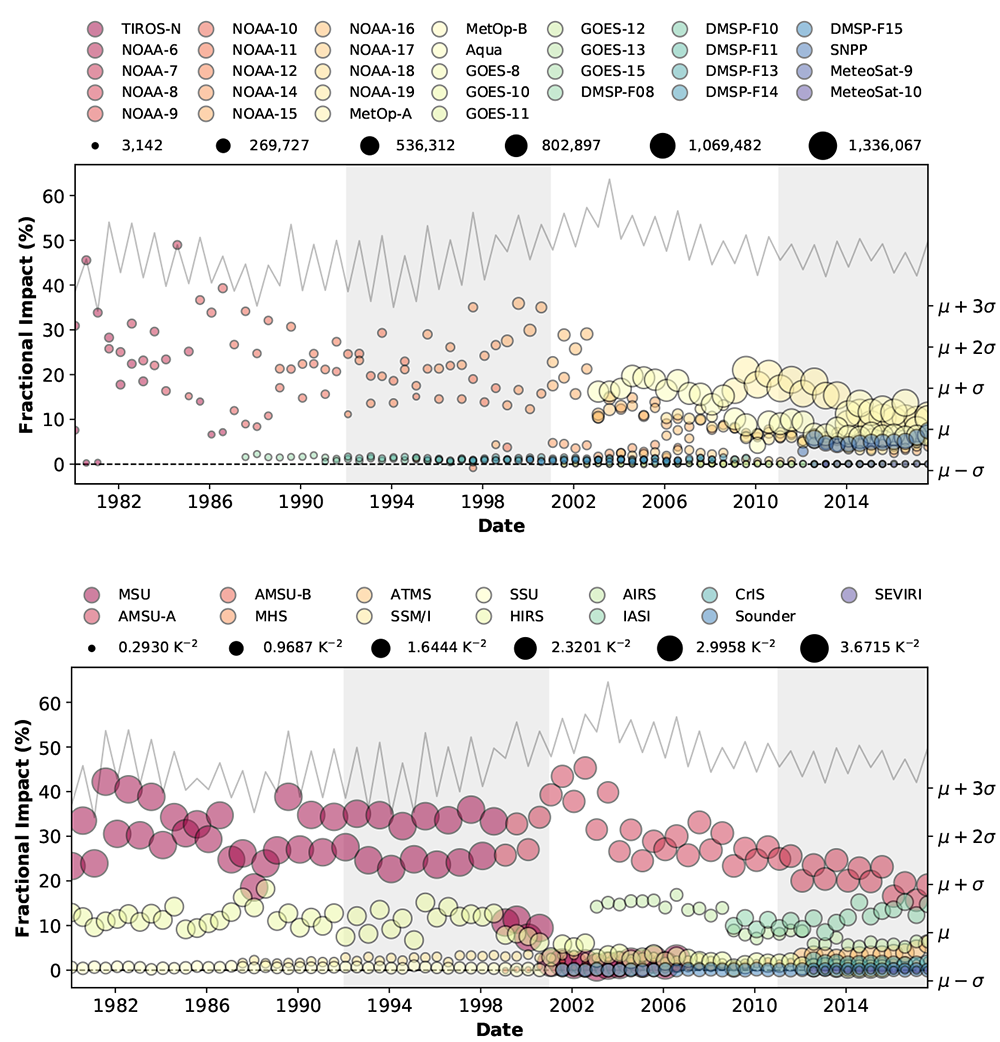
Figure 2
Figure 2: Monthly mean fractional observation impact for all radiance grouped as satellite (a) platforms and (b) sensors. Only results for 0000 UTC analyses during months of January and July are included. The line represents the sum of all bubble values for each month. The size of the bubbles is proportional to (a) the monthly mean observation count and (b) the inverse of the observation error variance assigned before the assimilation for each partition of the observing system. The units of fractional observation impact are % and of the inverse of the observation error variance are K-2.
The solid grey line in the panels of Fig. 2 indicate that from 2004 onwards the fractional contribution of assimilating brightness temperature decreases somewhat. Since fractions add up to 100%, this suggests that it should be possible to identify what other components of the observing system increase their contribution over the same period. Close examination reveals the fractional impact of wind observations to be on the rise. This is illustrated in Fig. 3, where the fractional impact of various observing systems reporting winds are displayed; the grey curve showing the sum of fractional impact from all wind observations. Largely Atmospheric Motion Vectors (AMVs) and Aircraft reports of winds explain most of the reduction in fractional contribution from radiance observations. On top of that, the heavy solid black curve shows the added contribution from bending angle observations derived from Global Positioning System Radio Occultation (GPSRO). Since its introduction in 2004, GPSRO has contributed from as little as 2% to as much as 10% to reduce errors in the short-range forecasts of MERRA-2.
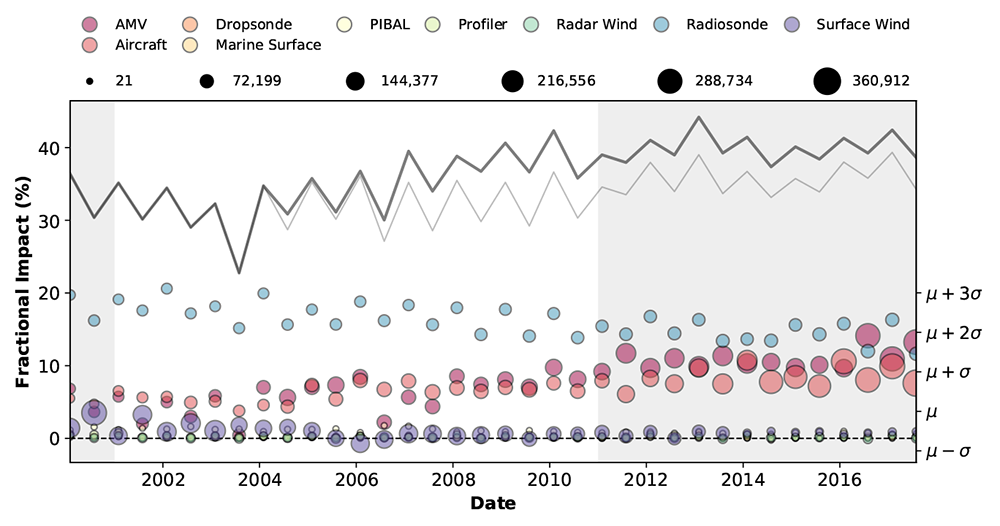
Figure 3
Figure 3: Similar to Fig. 2a, but for various sources of wind observations. The thin light grey curve represents the sum of fractional impact from all wind observation sources. The thick dark grey curve adds the contribution from GPSRO to those of wind observations.
Further analysis and finer breakdown of results is an ongoing part of the present exercise with a comprehensive report appear in the Quarterly Journal of the Royal Meteorological Society.
References:
Diniz F.L.R and Todling R., 2019. Forecast Sensitivity Observation Impact in a global Reanalysis. JCSDA Quarterly Newsletter Spring(63): 10–16, doi:10.25923/c23x-ac34.
Gelaro, R., and Co-authors, 2017. The modern-era retrospective analysis for research and applications, version 2 (MERRA-2). J. Climate 30(14): 5419-5454, doi:10.1175/JCLI-D-16-0758.1
Langland R.H., Baker N.L., 2004. Estimation of observation impact using the NRL atmospheric variational data assimilation adjoint system. Tellus A, 56(3): 189–201, https://doi.org/10.3402/tellusa.v56i3.14413
Tremolet Y., 2008. Computation of observation sensitivity and observation impact in incremental variational data assimilation. Tellus A 60(5): 964-978, doi:10.1111/j.1600-0870.2008.00349.x