
Impacts of 2019 Boreal Forest Fires on Atmospheric Pollution
Wildfires are ubiquitous phenomena on a global scale. Regionally, fires exhibit well pronounced seasonal cycle associated with the main ingredients that control the dynamics of individual fires—ignition source, fuel and weather. In remote regions wildfires typically start from cloud-to-ground dry lightning. Dry and windy weather patterns (i.e. lack of rain, low rootzone soil moisture and low humidity) increase the flammability of combustible vegetation and accelerate the rate of spread, intensity and size of fires. Intense fires can create pyrocumulus clouds and may produce dry lightning that could in turn start secondary fires kilometers away from the primary source. The burning vegetation releases the stored carbon back into the atmosphere in the form of CO2, CO and carbonaceous particles.
Link: https://gmao.gsfc.nasa.gov/research/science_snapshots/anim/Arctic_fires_2019-CO.mp4
Link: https://gmao.gsfc.nasa.gov/research/science_snapshots/anim/Arctic_fires_2019-pm.mp4
Link: https://gmao.gsfc.nasa.gov/research/science_snapshots/anim/Arctic_fires_2019-aod.mp4
Description of animations: Carbon monoxide (CO column, top), fine particulate matter at the surface (PM2.5, middle) and aerosol optical depth (AOD at 550nm, bottom) from fires in North America and Eurasia. Plots are shown from June 1, 2019 to August 18, 2019, using analyses from the NASA/GMAO near real-time atmospheric assimilation system GEOS-FP. Transport by the prevailing wind patterns carried smoke from the Siberian fires westward over Alaska and Canada, whereas smoke from the Alaskan fires was transported eastward and towards the North Pole.
In the summer, subarctic and Arctic regions also experience wildfires with varying intensity due to the natural variability in the weather patterns and fuel. The 2019 Boreal summer fire season was not an exception—NASA satellites have detected numerous persistent fires in the boreal forest and tundra in North America, and the taiga in Siberia. Using the NASA/GMAO numerical model GEOS and the observation-based QFED fire emissions (Darmenov and da Silva, 2015), emissions and transport from the 2019 fires have been analyzed and are compared with previous years.
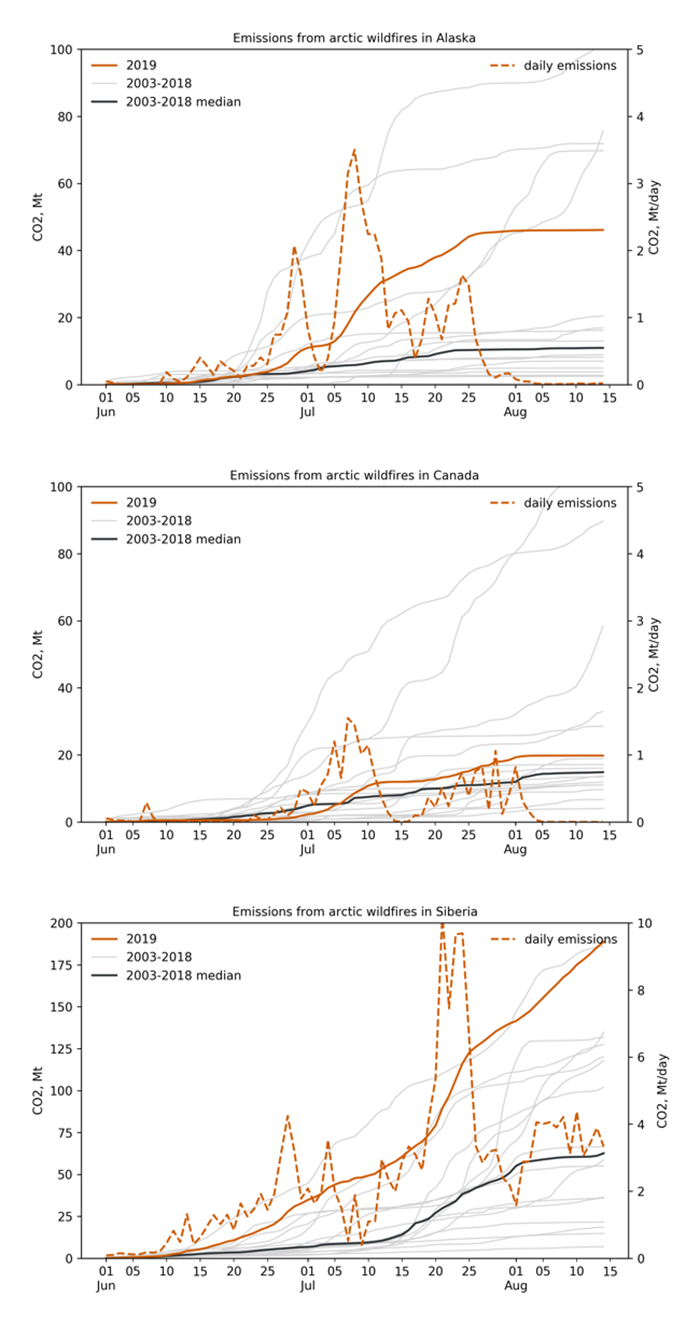
Figure Caption: Summarized results from the analysis of the CO2 emissions from fires in Alaska, Canada (north of 60N) and Siberia (North of 60N). Each graph shows the cumulative emissions since June 1 for the years 2003-2018 (solid gray lines), median of the historical emissions (solid black line) and 2019 (solid orange line), as well as time series of the daily regional emissions in 2019 (dashed orange line). The total emissions from fires in Alaska are the fifth highest since 2013, with about 40Mt of CO2 emitted between June 1 and August 15. Emissions from wildfires in the Northern Canada are close to the expected historical median. The total CO2 emissions from Siberian fires by August 15, 2019 were estimated to exceed 180 Mt and are on track to be the largest since 2003.
Specialized tracers of carbon monoxide (CO) in GEOS can be used to give an insight about the transport of constituents emitted from the fires in North America, Europe and Russia. Aerosol optical depth (AOD) and fine particular matter (PM2.5) are also available and can be used to assess the impact of the fires on aerosol load and surface concentrations. On July 28, 2019 PM2.5 downwind from the fires was elevated, and in some locations exceeded 100 mg/m3. On that date, smoke from the Siberian fires was carried westward over Alaska and Canada, whereas smoke from the fires in Alaska was transported eastward and towards the North Pole.
Link: https://gmao.gsfc.nasa.gov/research/science_snapshots/anim/Arctic_fires_2019-smoke.mp4
Description of animation: The NASA/GMAO atmospheric and aerosol assimilation system GEOS uses observations and numerical models to provide detailed view of the Earth’s atmosphere and surface. The GEOS system creates a digital record that can be used to monitor and study our dynamic planet. The image depicts smoke from fires in Alaska, Canada and Siberia during the 2019 fire season using information about the atmospheric composition from the near real-time GEOS system. The GEOS system is informed about the location and intensity of the fires from the QFED fire emissions product which is also generated by GMAO.
References
Darmenov, A. S., A.d. Silva, 2015: The Quick fire emissions dataset (QFED): documentation of versions 2.1, 2.2 and 2.4. NASA Technical Report Series on Global Modeling and Data Assimilation 38 (NASA/TM–2015–104606), R.D. Koster (Ed.), p. 212 Document