
American and European Heatwaves During Summer 2019
The summer of 2019 was marked by above average, and record-breaking warm temperatures around the globe. Heatwaves, defined here as at least three consecutive days where daily-mean temperature exceeds the 90th percentile, were a common occurrence in the Northern Hemisphere, particularly across Europe and the United States. Long time series are required in order to estimate climate statistics such as the percentiles of temperature, and the Modern Era retrospective Analysis for Research and Applications, Version 2 (MERRA-2) is a tool that can be useful for such studies. Here we examine the apparent linkages between heatwaves occurring in Europe and the United States throughout the summer and the features of the atmospheric circulation that contributed to persistent above-average temperatures in these regions.
Throughout the entire month of June 2019, over 20% of Europe met the criteria defining a heatwave according to MERRA-2 (Figure 1). The heat subsided in Europe for most of July and August aside from the periods of 24 July to 25 July and 27 August to 29 August when approximately 40% and 50%, respectively, of the region experienced heatwave conditions. Meanwhile, heatwaves were prominent across the continental United States during most of August in addition to events that occurred in the middle of June and July. It should be noted that the United States encompasses a much larger area, and it is rarely that a heatwave will span across the entire country. The west coast of the United States was excessively warm 10 June through 12 June, while the two periods in July with heatwaves were mostly due to high temperatures in the eastern and central United States. Throughout August, heatwaves were prevalent in regions across the entire United States. Though not necessarily the case for the whole summer, the timing and presence of widespread heatwaves tended to shift back and forth between Europe and the United States.
Animation Description: 12 hourly zonal mean anomaly in 500 hPa height (shading), 500 hPa height equal to 580 dam (green contour), and grid boxes where a heat wave was detected (red triangles) through the summer of 2019.
Link: https://gmao.gsfc.nasa.gov/research/science_snapshots/anim/Am_Euro_heatwaves-2019.mp4

Figure 1: The daily percentage of land area in Europe and the United States that experienced a heatwave (left axis) and the index representing the North Atlantic Oscillation through the summer of 2019.
Not only were the heatwaves more widespread in Europe compared to the United States, but the average temperature anomaly during a heatwave was larger in magnitude in Europe as well. As Figure 2 shows, heatwaves over the United States during summer 2019 were associated with average daily temperature anomalies of approximately 3.5 °C, while those over Europe were associated with anomalies of approximately 5 °C. There are some similarities between the size of the area under a heatwave and the temperature anomaly however the intense heatwaves can be limited in area, such as the case in the United States in mid-June. Despite the smaller size of Europe compared to the United States, both the area coverage and intensity of the heat were larger in Europe.
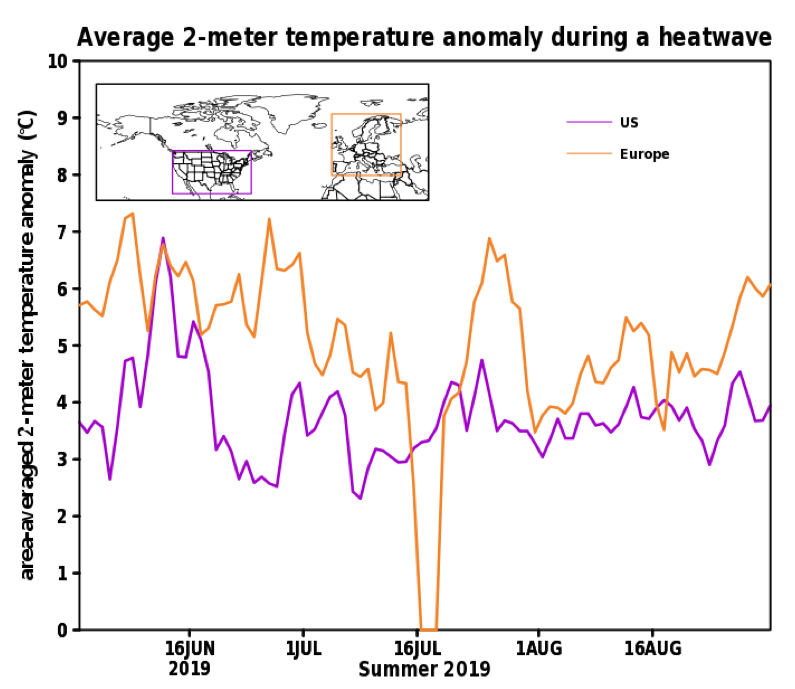
Figure 2: The daily 2-meter temperature anomaly averaged over all grid boxes experiencing heat wave conditions in Europe (orange line) and the United States (purple line) during summer 2019.
The North Atlantic Oscillation (NAO) has been connected with temperature extremes (Collow et al. 2017), and thus can potentially impact the prevalence of heatwaves. The positive phase of the NAO is characterized by enhanced pressure gradient between the Azores and Iceland and strong westerly winds over the North Atlantic, and above average temperatures over Europe (Barnston and Livezey, 1987; Folland et al., 2009). As can be seen by the dotted line in Figure 1, the NAO was in the negative phase for most of the summer. There are two periods in which the NAO switches to a positive phase, coinciding with the shorter lived, but widespread heatwaves in Europe during the end of both July and August. On the other hand, the NAO is negatively correlated with temperatures exceeding the 90th percentile across the southern United States spanning from Texas to the Carolinas during the summer months (Collow et al., 2017), indicating that the negative phase of the NAO is associated with warm temperatures in that region.
While the NAO does seem to play a role, it is important to note that other factors such as sea surface temperatures and local land-atmosphere interactions can contribute to synoptic scale weather patterns and heatwaves. Another component of the atmosphere that played a role in the 2019 summer heatwaves is the “waviness” of the flow, often associated with the presence of quasi-stationary Rossby waves (Schubert et al. 2011). As can be seen in the animation, there are numerous instances when the contour for 500 hPa height takes on a north-south orientation near a region experiencing a heatwave. A strong area of high pressure, demonstrated by the orange shading in the animation, can prevent zonal flow and allow for a build-up of heat, a phenomenon commonly referred to as blocking. Blocking has been shown to have been associated with heatwaves in the past (Schaller et al., 2018) and was a likely culprit for those that occurred in Europe during the summer of 2019. Dynamical links and the presence of a Rossby wave train may have played a role in the existence of heat waves across two different continents.
Acknowledgements
This project was supported by NASA Earth Science: National Climate Assessment Enabling Tools program. MERRA-2 was developed under the NASA Modeling Analysis and Prediction program. Thank you to Joe Ardizzone for his assistance with the animation.
References
Barnston, A.G. and R.E. Livezey, 1987: Classification, Seasonality and Persistence of Low-Frequency Atmospheric Circulation Patterns. Mon. Wea. Rev.,115, 1083–1126, doi: 10.1175/1520-0493(1987)115<1083:CSAPOL>2.0.CO;2.
Collow, A. B. M., S. P. Mahanama, M. G. Bosilovich, R.D. Koster, and S. D. Schubert, 2017. An Evaluation of Teleconnections Over the United States in an Ensemble of AMIP Simulations with the MERRA-2 Configuration of the GEOS Atmospheric Model. NASA/TM-2017-104606, Vol. 47, 68 pp. Document
Folland, C.K., J. Knight, H.W. Linderholm, D. Fereday, S. Ineson, and J.W. Hurrell, 2009: TheSummer North Atlantic Oscillation: Past, Present, and Future. J. Climate,22, 1082–1103, doi:10.1175/2008JCLI2459.1.
Schaller, N., Sillmann, J., Anstey, J., Fischer, E.M., Grams, C.M. and Russo, S., 2018. Influence of blocking on Northern European and Western Russian heatwaves in large climate model ensembles. Environmental Research Letters, 13(5), doi: 10.1088/1748-9326/aaba55.
Schubert, S., H. Wang, and M. Suarez, 2011: Warm Season Subseasonal Variability and Climate Extremes in the Northern Hemisphere: The Role of Stationary Rossby Waves. J. Climate, 24, 4773–4792, doi:10.1175/JCLI-D-10-05035.1.