
Active Winter Weather Forecasted over North America follow a Major Stratospheric Sudden Warming Event
The stratospheric has experienced its first major mid-winter stratospheric sudden warming (SSW) event since January 2013. This is the also the first major “wave-2” SSW event (where the stratospheric polar vortex splits in two) since January 2009. In a major SSW event, the temperature in the polar night stratosphere increases by as much as 40C and the average winds at 60N reverse direction from their typical west-to-east flow.
In 2018 the zonal winds reversed on 12 February. The GMAO 's global Goddard Earth Observing System forward processing (GEOS-FP) system successfully tracked the development of this SSW in it's routine 10-day forecasts. Here, we illustrate the breakdown of the polar vortex and the forecasting of the lower stratospheric and surface weather after the SSW event occurred.
In mid February 2018, the stratosphere experienced a major stratospheric sudden warming (SSW) event, in which the polar vortex has split into two pieces as warm air flowed into the polar cap. It is known that some SSW events are associated with surface weather changes. In this case, both stratosphere and troposphere features appear to be evolving together, with large day-to-day changes in surface temperature occurring under the larger piece of the polar vortex that is located over North America.
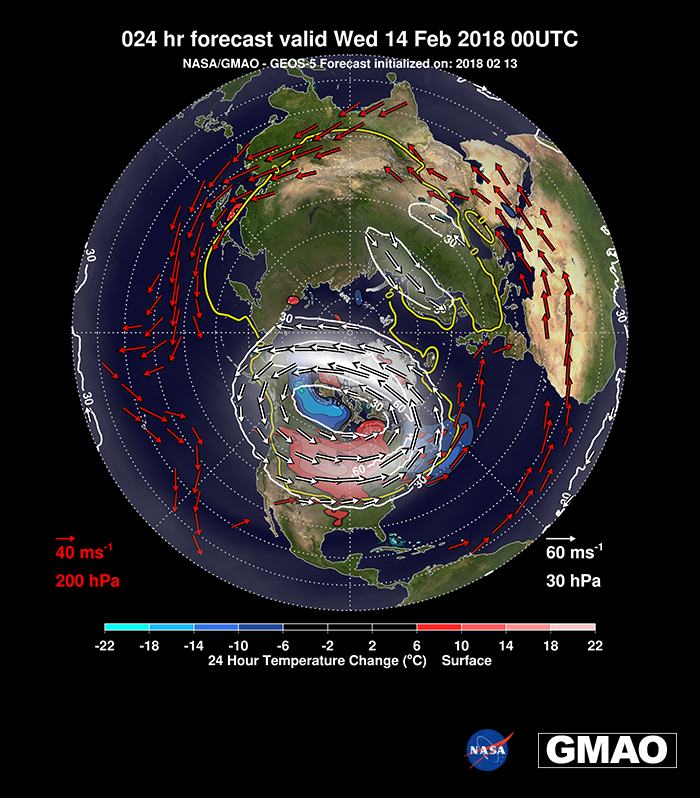
This image shows the 24-hour forecast valid on February 14, 2018. The lower stratospheric winds are denoted by the white contours and white wind vectors, highlighting that the main stratospheric polar vortex is centered over North America, while the weaker second part of the polar vortex is over Europe. Surface weather systems are denoted by the filled red and blue contours, that depict 24-hour increases and decreases in surface temperature between February 13 and February 14. These patterns show changes of more that 10C in surface changes, associated with air masses circulating around the deep vortex – these patterns are largely absent over Europe and Asia.
These features persist in the full 10-day forecast shown in the accompanying animation at: https://gmao.gsfc.nasa.gov/research/science_snapshots/anim/fcst_30mb_sfc_2018021300.mp4
The dramatic stratospheric polar vortex splitting is shown in the first animation below, where the high values of EPV (Ertel's Potential Vorticity, yellow and orange) denote the polar vortex region while low values of EPV (blue) denote tropical air. Between these high and low values (transparent) is a well mixed region of air characterized by nearly constant EPV. The vortex is initially strong in January (high EPV) but moves off the pole in late January, pulling tropical air to higher latitudes, a process know as “wave breaking” that tends to weaken the polar vortex.
The two red contours (geopotential height at 200 hPa, ~11 km) denote the poleward part of the upper tropospheric jet stream. On 3-6 Feb these contours move poleward in the region just east of Greenland with the potential for disturbing the strong stratospheric vortex winds directly above. By 12 Feb the stratospheric vortex has split in two, as tropical air continues to be mixed poleward around each of the distinct vortices and the air over the pole warms.
To view the full-size animated version, visit:
https://gmao.gsfc.nasa.gov/research/science_snapshots/anim/fp_analysis_201801.mp4
There is evidence that some SSW events are associated with surface weather changes. In this case, after the SSW wind reversal date of 12 Feb, there is a substantial cooling over Europe as Arctic air flows southwards, and there are large day-to-day fluctuations in surface temperature over North America. The still image illustrates the congruence of the stratospheric polar vortex and the near-surface weather. It shows the 24-hour forecast, valid on 14 Feb 2018 at 00UTC. The lower stratospheric winds (30 hPa) are denoted by the white contours (30 and 60 m/s, white shading) and white wind vectors. These winds show that the main stratospheric polar vortex is centered over North America, while the second, split-off, part of the polar vortex is over Europe and has become much weaker. Surface weather systems are denoted by forecasted 24 hour change in surface temperature change, where filled red and blue contours represent, respectively, increases and decreases of more than 10C.
These patterns show how the cooling and warming temperatures over North American occur as air masses are transported around the deep polar vortex that is visible in the stratosphere. Note that similar patterns of day-to-day change are largely absent over Europe and Asia during this time. The tropospheric jet stream, denoted by winds at 200 hPa (red arrows), is mainly east-to-west in orientation over Asia, an alignment that is consistent with the lack of surface weather features. Over N. America the troposphere and stratosphere winds are often aligned at these times forming a strong and very deep jet over this region. These features persist in the full 10-day forecast shown in the second animation below, which illustrates very clearly the circulation of the surface weather patterns around the displaced polar vortex over North America.
To view the full-size animated version, visit:
https://gmao.gsfc.nasa.gov/research/science_snapshots/anim/fcst_30mb_sfc_2018021300.mp4