
Mid-Atlantic Local Area Flooding, July 21-25, 2018
July 2018 began with record-setting dry conditions in the Mid-Atlantic region. Signs of a change in the circulation pattern became evident around the middle of the month. In accord with other 5-10 day forecasts, NASA’s GEOS FP (Forward Processing) system indicated a mid-level height anomaly pattern analogous with those of prior notable long-duration and major Middle Atlantic rainfall events.
GEOS FP long range forecasts showed a shift in the typical position of the Bermuda-Azores High some 10-30 degrees westward in the Atlantic. Another strong high center was also forecast to be anchored over the Four Corners region of the Southwest US. Between these two centers, a trough of lower than normal heights running from North to South from the Great Lakes all the way down to the Gulf Coast, which is unusually far South for July. The Mid-Atlantic region was thus located downstream of this trough, with the mean flow in a deep layer of the atmosphere directed from South to North. As such, a deep layer of tropical moisture from the Gulf of Mexico could readily be advected northward along the East Coast. While this flow pattern provided total precipitable water (TPW) anomalies that were 2-3 standard deviations above climatology, there would still need to be the synoptic-scale and/or meso-scale features to focus this moisture into deep precipitating clouds.
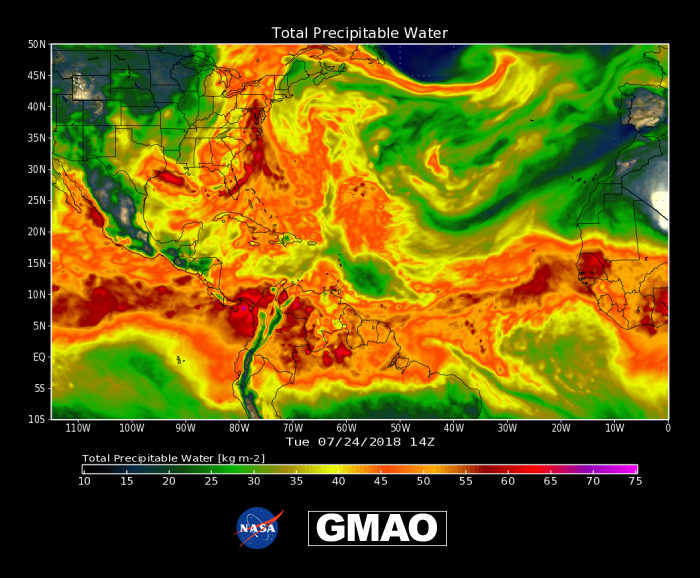
Total precipitable water is the depth of water in a column of the atmosphere, if all the water in that column were precipitated as rain.
The primary synoptic-scale trigger was seen as a negatively tilted 500hPa shortwave trough approaching from the West late on Friday July 20th. Given the downstream diffluent pattern to the East, an unusual out-of-season, cold-core, low-pressure system developed over eastern North Carolina early on Saturday July 21st. With the steering pattern established as the South to North flow over the region, this low moved from North Carolina up into the Chesapeake Bay by late day Saturday. Daily rainfall totals were a uniform 2-4 inches within the Baltimore-Washington corridor. Another unusual facet of this storm was in how the cloud-level processes were more reminiscent of warm-core systems, resulting in a tremendous amount of latent heat being released from the deep precipitating cloud systems. Local surface temperatures, however, were held into the low 60s that afternoon due to a northerly ageostrophic flow, corroborating that on the synoptic scale this system was clearly rooted in baroclinic development.
That low center lifted on Sunday July 22, returning the region back in the moist southerly and high TPW flow. Local differential heating boundaries from the prior day provided the trigger mechanisms for additional waves of periodic intense convection on Sunday. Unlike Saturday, though, where the rainfall was more uniform through the day, Sunday’s bursts of convection dropped less homogeneous areal rain totals. The general flow pattern continued undisturbed Monday through Wednesday (23rd-25th) but with fewer focal mechanisms to induce organized rainfall as earlier that weekend. Finally, the plume of high TPW was predicted by GEOS FP forecasts and demonstrated in the analyses to be gradually eroded from West to East as the blocking Bermuda-Azores high retreated to its more climatological position, allowing for a more zonal and drier flow over the Mid-Atlantic.
GMAO GEOS Forecast Animation: https://gmao.gsfc.nasa.gov/research/science_snapshots/anim/GEOS_TPW_Forecast.mp4
This is the GEOS FP forecast of total precipitable water initialized on 18 July 00z. Each frame is a one hour time-step throughout the period of local excessive rainfall. Note the long duration plume of oranges and reds indicating high precipitable water values training over the same general location of the Mid Atlantic.
GMAO GEOS Analysis Animation: https://gmao.gsfc.nasa.gov/research/science_snapshots/anim/GEOS_TPW_Analysis.mp4 This animation is the GEOS FP analysis of total precipitable water each hour throughout the event. Note how well the placement of the analyzed high precipitable water plume agrees with the forecast made several days earlier.