
Space-based and Data Assimilation Views of Total Ozone
The stratospheric ozone layer is produced by solar UV radiation, however its global distribution is also determined by stratospheric winds, so that regions of high and low ozone are continually changing. These ozone changes can be tracked from space and assembled into a complete global data set through data assimilation. A data assimilation system (DAS) combines a global model, that includes winds and temperatures and well as ozone, with the available observations to provide an ozone data set that is regular in both space and time. The GMAO’s Goddard Earth Observing System (GEOS) DAS has been used to produce the Modern-Era Retrospective analysis for Research and Applications, Version 2 (MERRA-2) dataset, which begins in 1980 and runs to the current time, that includes ozone observations from NASA’s EOS-Aura satellite that was launched in 2004.
Global maps of total column ozone (DU) at 16UTC on 28 August 2017. High values, where ozone is more abundant, are emphasized in purple, while lower values are shown in more transparent green. The four panels show assimilated ozone from MERRA-2 (upper left) and observations from EOS-Aura OMI (upper right), Suomi-NPP OMPS-NP (lower left) and DSCOVR-EPIC (lower right).
The MERRA-2 values are on a global grid at the nominal time. The observations are all accumulated over the preceding day, with each observation location denoted by a filled circle.
While each panel shows a similar ozone distribution, it is obvious that the assimilation smooths over the orbital and uncertainty features in the observed fields.
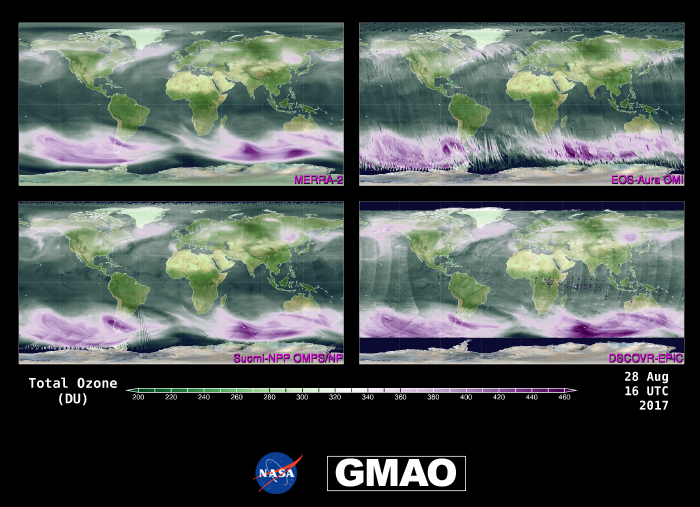
The figure shows four different views of the total vertical ozone column at 16UTC on 28 August 2017, from MERRA-2 and three different satellite instruments. The image illustrates the differences in spatial coverage of the ozone observations, a consequence of the different viewing geometries and orbits of the satellites, as well as their measurement uncertainties, contrasting them with the global coverage that is inherent in the assimilated product from MERRA-2 (upper left). This MERRA-2 total ozone column is computed from the complete three-dimensional ozone field that is transported by the GEOS model and constrained by the assimilation of ozone measurements from both the Ozone Monitoring Instrument (OMI), which retrieves the total column, and the Microwave Limb Sounder (MLS), which retrieves the ozone profile between the upper troposphere and the mesosphere (around 8-10km to 80km above the surface of Earth). The MERRA-2 ozone field highlights the well-know characteristics of ozone in August: low values inside the polar vortex over Antarctica are surrounded by a collar of high ozone concentrations that contains a typical “wavenumber 2” feature (with maxima at two different longitudes); low total-column ozone values are evident in the Tropics, where the tropopause is high, so low tropospheric ozone concentrations have a dominant signature in the total-column ozone; higher total-column ozone values in the northern (summer) hemisphere have a signature of weather systems that cause the depth of the troposphere to rise and fall in the East-West direction.
Each of the three observed datasets contains unique features. The OMI total column ozone instrument (upper right) measures in swaths that are oriented from South-East to North-West on the polar orbiting EOS-Aura satellite producing global coverage each day as the Earth rotates below the satellite. The image shows observations accumulated over three three days prior to the nominal time of the plot, to aid in filling in the ozone field. These OMI observations are assimilated in MERRA-2, so the good agreement between the two upper panels is expected. The “streaky” nature of the OMI plot arises because the three days of observations are needed to fill the globe, compared to the global dataset available each hour from MERRA-2, where the GEOS model is used to fill in the gaps between these different observations at every assimilation time. The Ozone Mapping and Profiling Suite – Nadir Profiler (OMPS-NP) ozone observations (lower left), also on a polar orbiting satellite (Suomi-NPP), show a newer instrument’s view of total ozone. The field appears generally smoother than for OMI, because the width of the OMPS-NP observing swath is wider. The Earth Polychromatic Imaging Camera (EPIC) instrument provides a very different view of the total-column ozone field (bottom right). EPIC is installed on the DSCOVR spacecraft that provides a view of the sunlit face of Earth from about 1 million miles away – each snapshot of Earth provides a view of the entire illuminated disc. The character of these observations, which are used each hour for these plots, leads to a much smoother image than for OMI, but these ozone retrievals do contain a signature of the Earth’s disc as it rotates beneath the instrument.
GMAO is working to assimilate all of these ozone observations in future real-time analyses and, eventually, in new reanalysis products that will replace MERRA-2. This plot, and the accompanying animation, provide scientists with visual information that feeds in to development of quantitative metrics of the relative differences among the various data types, which in turn translates into suitable error models and debiasing of the different observations that are available for use.
The accompanying animation shows the total ozone fields through August and September 2017. In addition to the characteristics of each observation type for the total ozone that are evident in the image shown here, the animation highlights how the data assimilation process leads to dynamical fields of ozone in MERRA-2. Time sequences of the OMI, APMS-NP and EPIC observations emphasizes the changing coverage of the instruments over the globe, as the instruments orbit the Earth (OMI, OMPS-NP) or the Earth rotates under the sun (EPIC). The assimilation process results in global ozone distributions at every location in the MERRA-2 dataset, so the animation emphasizes the dynamical evolution of the global ozone field as it is transported around the globe.
To view the full-size animated version, visit: https://gmao.gsfc.nasa.gov/research/science_snapshots/anim/total_ozone_views.mp4