
SMAP Soil Moisture and Drought in Ethiopia
[ Adapted from a NASA Earth Observatory story by Kathryn Hansen, Joshua Stevens, and Jesse Allen. See (http://earthobservatory.nasa.gov/NaturalHazards/view.php?id=87886). ]
In 2015, Ethiopia endured its worst drought in decades. Satellite data can help show the conditions on the ground that are relevant for agriculture. From March to May, Ethiopia is in its secondary crop season, the “belg”, a short rainy season. Successful harvest of belg crops depends on adequate rainfall.
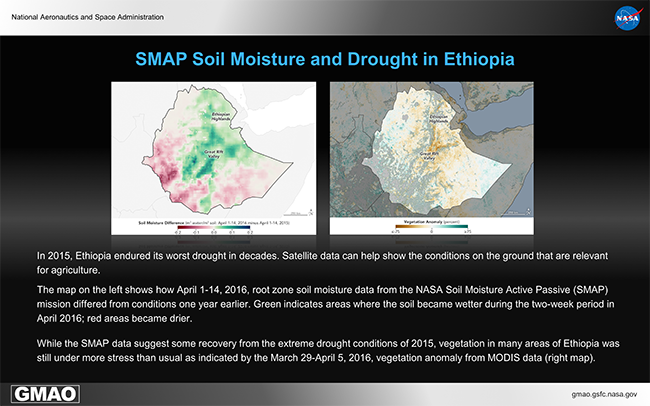
The map on the left shows how root zone soil moisture in Ethiopia, averaged from April 1 to April 14, 2016, differed from conditions one year earlier. Green indicates areas where the soil became wetter during the two-week period in April 2016; red areas became drier. The map indicates wetter conditions in central Ethiopia in April 2016 and suggests some recovery from the extreme drought of 2015.
The map is based on observations from NASA’s Soil Moisture Active Passive (SMAP) satellite, which are sensitive to soil moisture in the top 5 centimeters of the ground. The SMAP Level 4 Soil Moisture (L4_SM) data product used here combines SMAP measurements with other information such as temperature and previous rainfall amounts in a land data assimilation system. The L4_SM data thus estimate the amount of moisture from the surface down to 1 meter, where the roots of most plants access water. The distinction between surface and root zone soil moisture is important in terms of the memory associated with the two layers. It takes much longer to recover from an anomaly in the much thicker root zone layer. In the context of droughts, a single rainstorm, no matter how large, isn’t enough to break the drought. But it could well fill up the surface layer to saturation.
The belg rains came early in 2016, beginning in February, and allowed planting in the highlands to be underway by March, when the belg usually begins. However, satellite data indicated that the vegetation in many areas of Ethiopia was still under more stress than usual in early April 2016, visible in the map on the right. Brown areas show where plant growth, or “greenness,” was below normal. Greens indicate vegetation that is more widespread or abundant than normal for the time of year. Grays depict areas where reliable data were not available, usually due to cloud cover.
The map on the right shows the March 29 to April 5, 2016, anomaly in the Normalized Difference Vegetation Index (NDVI) from the Moderate Resolution Imaging Spectroradiometer (MODIS) on NASA's Aqua satellite. The anomaly is relative to the long-term average from 2000–2015. The NDVI is a measure of how plants absorb visible light and reflect infrared light. Drought-stressed vegetation is less green, and satellites, through NDVI measurements, can pick up on this.
References
Famine Early Warning Systems Network (2016, March) East Africa: Ethiopia. Accessed April 15, 2016.
Famine Early Warning Systems Network (2016, April 1-7) Global Weather Hazards Summary: Africa Weather Hazards. Accessed April 15, 2016.
FAO GIEWS Country Briefs (2016, March 9 ) Ethiopia. Accessed April 15, 2016.
NOAA (2016, April 14-20) Climate Prediction Center’s Africa Hazards Outlook. Accessed April 15, 2016.
Reichle, R. et al. (2016) SMAP L4 9 km EASE-Grid Surface and Root Zone Soil Moisture Geophysical Data, Version 1. Boulder, Colorado USA. NASA National Snow and Ice Data Center Distributed Active Archive Center.
Reliefweb (2016, January) Ethiopia: Drought. Accessed April 15, 2016.
Reuters (2016, March 7) Drought-hit Ethiopia needs money for seeds as rains begin. Accessed April 15, 2016.
The World Bank (2016) Ethiopia. Accessed April 15, 2016.