
Influence of ENSO on Wintertime Precipitation
M2AMIP [for Modern-Era Retrospective Analysis for Research and Applications, Version 2 (MERRA-2) Atmospheric Model Intercomparison Project (AMIP)] is a set of simulations performed with the atmosphere and land components of the NASA Goddard Earth Observing System Model, Version 5 (GEOS-5), version 5.12.4, following the style of AMIP experiments endorsed by the Working Group on Numerical Experimentation of the World Climate Research Programme (Gates, 1992). M2AMIP uses the atmospheric model that was used for MERRA-2, the most recent NASA re-analysis data product. Molod et al. (2015) provide a description of the model.
AMIP-style experiments enable the discovery of biases within an atmospheric model without the complexity of ocean-atmosphere feedbacks, especially when compared to their observation-constrained counterpart (MERRA-2); M2AMIP overlaps the time period of MERRA-2, spanning January 1980 through December 2015, allowing a direct comparison between their climates. Since this is an atmosphere-only model experiment, sea surface temperature (SST) and sea ice boundary conditions are prescribed in the same way as in MERRA-2. An evaluation of the MERRA-2 climate relative to available independent observations can be found in Bosilovich et al. (2015). To account for model variability, M2AMIP contains ten ensemble members, each spanning the entire time period, and each initialized with a slightly different atmospheric state based on the MERRA-2 reanalysis from November 1979.
Teleconnection patterns, typically comprised of two to four centers of action of low frequency variability that are, at times, 2500-6000 km apart (Barnston and Livezey, 1987), can persist on timescales of weeks to months but can impact day-to-day weather around the globe by influencing the planetary-scale circulation, including the atmospheric jet streams. These atmospheric patterns often form the basis of seasonal predictions, and it is therefore important to ensure that the atmospheric model used for MERRA-2 and M2AMIP can capture the associated teleconnections accurately. The El Niño/Southern Oscillation (ENSO) is a well documented coupled mode of variability in the atmosphere-ocean system that is characterized by above-average SST in the tropical Pacific Ocean during its positive phase. Indices such as the Niño3.4 index — the SST anomaly within the region of 5°N, 5°S, 170°W and 120°W — are used to define the strength and phase of ENSO. In an effort to evaluate the atmospheric response to ENSO over the United States, correlations were computed between the Niño3.4 index and precipitation in (panel a below) M2AMIP and (panel c below) gridded gauge observations over the period of 1980 through 2015. The color bar values represent correlations that are statistically different from zero at the 95%, 99%, and 99.99% confidence levels.
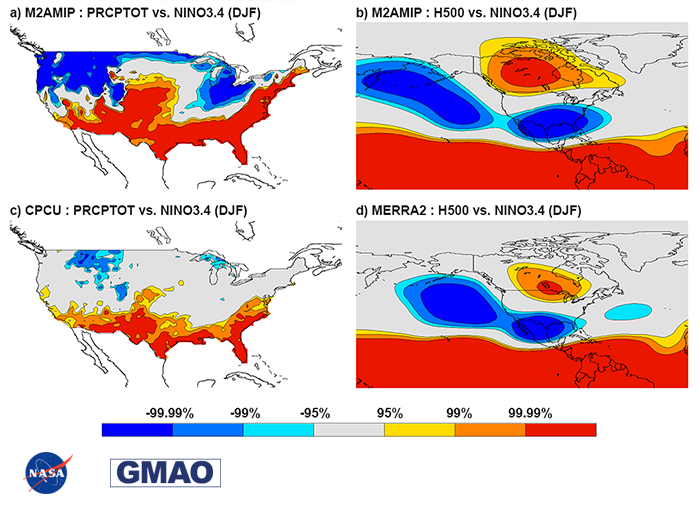
The figure in the Snapshot shows — in December, January, and February — statistically significant (a) correlation between Niño3.4 and M2AMIP total precipitation, (b) correlation between Niño3.4 and 500 hPa heights in M2AMIP, (c) correlation between Niño3.4 and observed total precipitation, and (d) correlation between Niño3.4 and 500 hPa heights in MERRA-2 (a proxy for observations). The contours show significance levels.
» Click for PDF «
The most substantial influence of ENSO on day-to-day weather in the United States occurs during the winter season of December, January, and February (DJF). The Niño3.4 index has a statistically significant positive correlation with the total seasonal precipitation in the southern portion of the country (i.e., the positive phase of ENSO is associated with above average precipitation) and a negative correlation over the Great Lakes and the Montana area (the positive phase of ENSO is associated with drier than average conditions). This pattern can be seen in M2AMIP (Panel a), observations (Panel c), and MERRA-2 (not shown), with excellent agreement between the observations and MERRA-2. The agreement between MERRA-2 and the observations is expected given that the atmosphere in MERRA-2 is constrained by observations through data assimilation. M2AMIP extends the positive correlation up the east coast and the negative correlation in the northwest to the Pacific coast (Panel a); given the differences between MERRA-2 and M2AMIP in the 500 hPa-Niño3.4 correlations (Panels b and d), this is not unreasonable.
A larger area within the United States has a statistically significant correlation between precipitation and Nino3.4 in M2AMIP compared to the observations, a result of the fact that for M2AMIP, averaging over the ensemble of simulations reduces the impact of internal variability (noise). In general, positive correlations between precipitation and Niño3.4 are seen where there is a negative correlation between 500 hPa height and Niño3.4 and vice versa, likely due to increased storminess along a trough across the country. The negative correlation between DJF Niño3.4 and 500 hPa height in M2AMIP has a northeastward tilt extending from the southwestern to the northeastern part of the US, whereas MERRA-2 does not have a negative correlation further north or east than South Carolina (Panels b and d). Similarly, the positive correlation between DJF Niño3.4 and 500 hPa height extends further to the west in M2AMIP than in MERRA-2. Wet conditions along the southern portion of the country during El Niño conditions have previously been documented in the literature. In fact, our results for the correlation between Niño3.4 and total precipitation are very similar to those shown in Figure 1 of Wise et al. (2015), which depicts the correlation between cool season standardized precipitation and the Southern Oscillation Index, an atmospheric-based metric used characterize ENSO.
Again, the realism of the teleconnections simulated within the free-running atmospheric model, evaluated here through comparisons of observed and simulated correlations between Niño3.4 and continental precipitation, has important implications for the GMAO’s seasonal forecasting effort – the forecast model may, for example, predict Niño3.4 accurately, but unless this Niño3.4 forecast translates to improved forecasts of continental weather (where the people live), the value of the forecast will be limited. The results presented here are positive overall, indicating that the atmospheric model used for MERRA-2 and M2AMIP is able to accurately portray the relationship between ENSO and seasonal precipitation in the United States. Generally positive comparisons between M2AMIP and observations also apply (not shown) to mean temperature and daily extreme temperature events in relation to ENSO. In addition, the M2AMIP simulations show largely realistic teleconnection responses to the Pacific Decadal Oscillation, the North Atlantic Oscillation, and the Pacific-North American Pattern (Collow et al., 2017).
References
Barnston, A. and R. Livezey, 1987: Classification, Seasonality and Persistence of Low-Frequency Atmospheric Circulation Patterns. Mon. Wea. Rev., 115, 1083–1126, doi: 10.1175/1520-0493(1987)115<1083:CSAPOL>2.0.CO;2.
Bosilovich, M. G., et al., 2015: MERRA-2: Initial Evaluation of the Climate. NASA/TM–2015–104606, Vol. 43, 139 pp.
Collow, A.B.M., S.P. Mahanama, M.G. Bosilovich, R.D. Koster, and S.D. Schubert, 2017: An Evaluation of Teleconnections Over the United States in the MERRA-2 Atmospheric Model. NASA/TM–2017–104606, Vol. 47.
Gates, W. L., 1992: AMIP: The Atmospheric Model Intercomparison Project. Bull. Ameri. Meteor. Soc., 73, 1962-1970, doi: 10.1175/1520-0477(1992)073<1962:ATAMIP>2.0.CO;2.
Molod, A. M., L. L. Takacs, M. Suarez, and J. Bacmeister, 2015. Development of the GEOS-5 atmospheric general circulation model: evolution from MERRA to MERRA2. Geosci. Model Dev, 8, 1339-1356. doi: 10.5194/gmd-8-1339-2015.