
A New Look at the 2015-2016 El Niño
Snapshot: Daily Sea Surface Temperature Anomaly and Ocean Currents
El Niño is a recurring climate pattern characterized by warmer than usual ocean temperatures in the central and eastern equatorial Pacific. Hand-in-hand with these changes in sea-surface temperatures are the anomalies in the wind-driven ocean currents that move the waters along the Equator across the Pacific Ocean. This image shows the oceanic state on November 15, 2015. It accompanies new visualizations depicting the three-dimensional evolution of the 2015-2016 El Niño event. It shows the upper layers of the tropical Pacific Ocean.
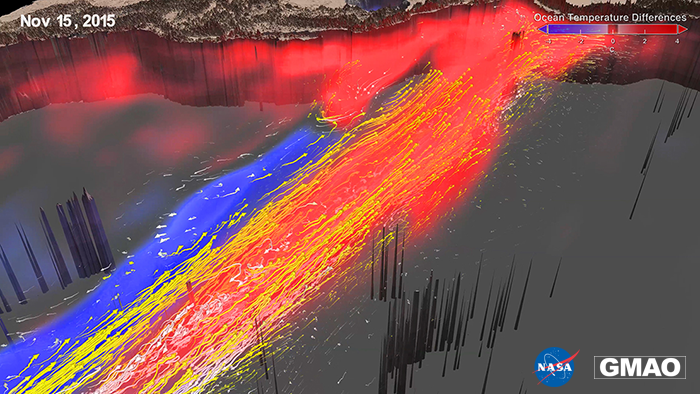
The Equator runs approximately from bottom left to top right of the frame. The vertical scale is exaggerated substantially. Warmer-than-normal temperatures (warm anomalies) are depicted in red, while cool anomalies are depicted in blue – the shading emphasizes anomalies with magnitudes between 2°C and 4°C, with lower positive and negative values left transparent. Along with the temperatures, the visualization depicts the anomalous ocean currents, from the ocean's surface to a depth of 225 meters: Yellow arrows illustrate eastward currents and white arrows are westward currents. Fluctuating strengths of westerly wind (directed towards the East) are known as “westerly wind bursts”. These winds force the ocean surface and provide the trigger for the El Niño to develop.