MERRA-2 Reanalysis Visualizations Available in FLUID
04.08.20
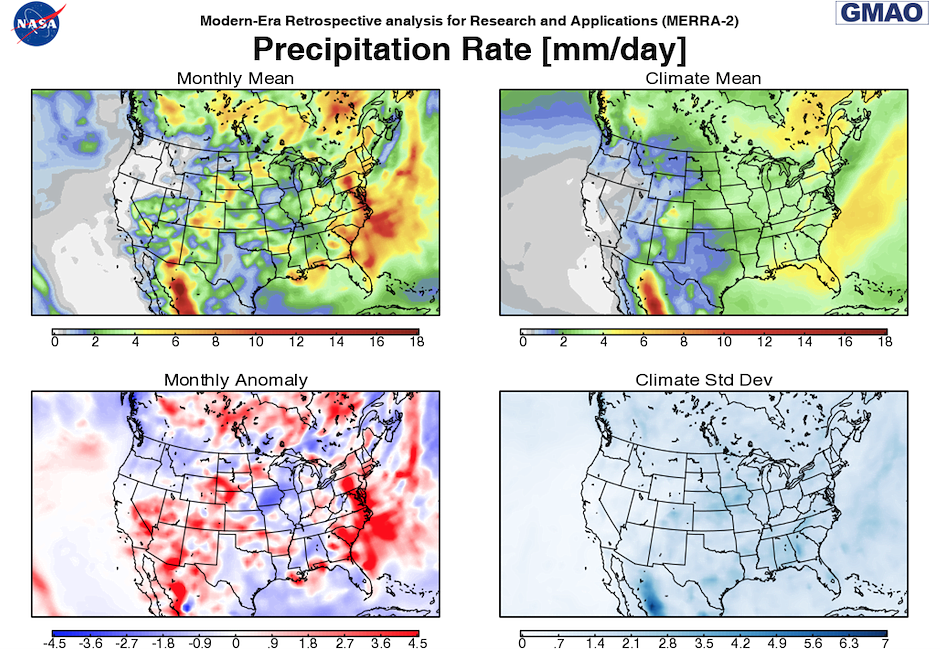
The GMAO is pleased to announce that an update for the MERRA-2 reanalysis visualizations is now publicly available on the FLUID webpage at https://fluid.nccs.nasa.gov/reanalysis/. In addition to hourly weather and atmospheric composition figures, this update features the introduction of two new collections of images that highlight the capability of the multi-decadal dataset. In the "Climatology and Anomalies" collection, users can find monthly mean fields, the 30-year climatology, the monthly anomaly with respect to the climatology, and the climatological standard deviation, as shown in the example below.
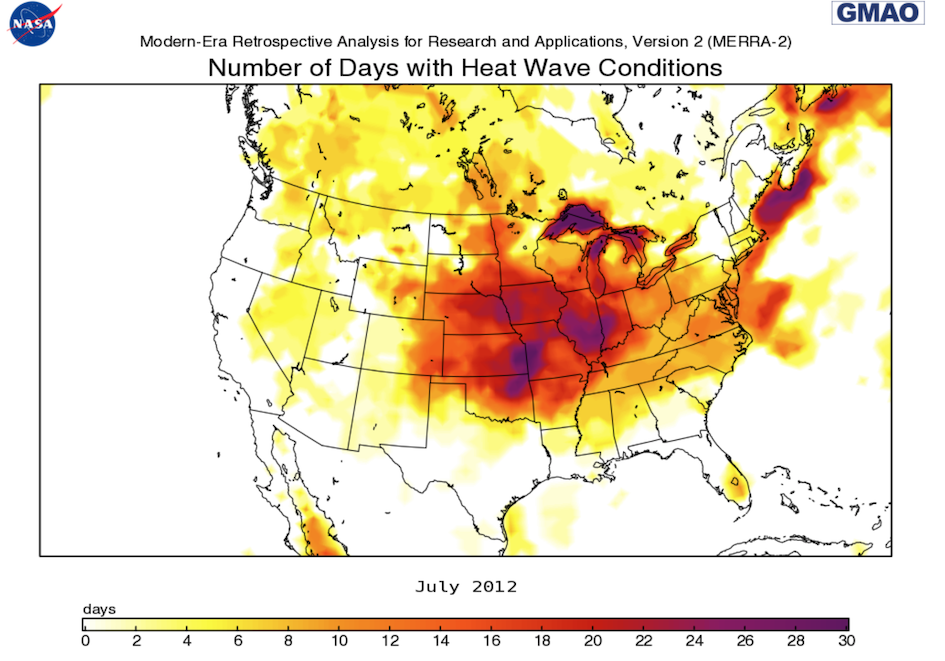
The additional "Climate Statistics" collection provides monthly indices that represent daily extreme weather events and percentiles to show how extreme or normal a given month was with respect to surface air temperature and precipitation. These statistics require a 30-year dataset, such as MERRA-2, to adequately capture the extreme events. For example, the number of days with heat wave conditions across the United States during July 2012 is shown below.