IEA Meeting Highlights Applications of GMAO Reanalysis in Wind Energy Development
5.24.2024
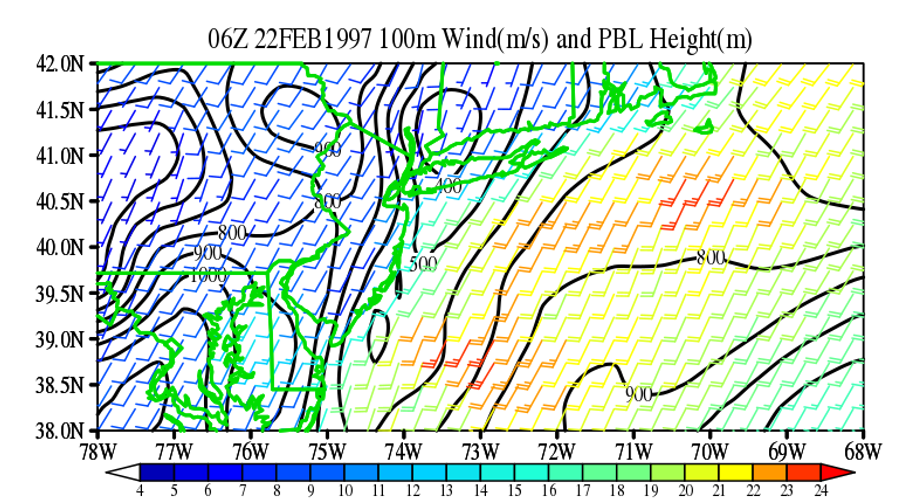
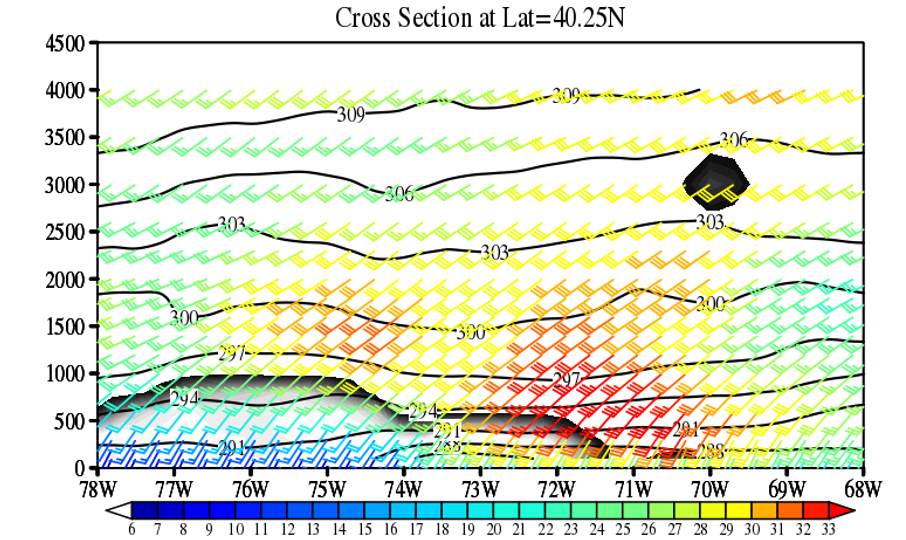
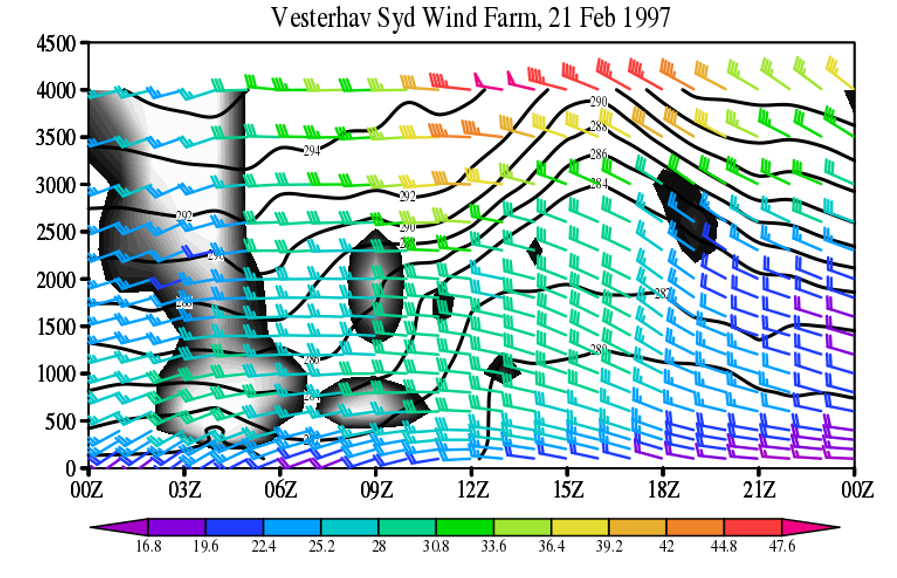
This past April, the International Energy Agency (IEA) hosted a meeting of wind energy planners and reanalyses developers to discuss the uses and future plans of reanalysis data. In one particular use case, a private company used short-term lidar wind observations and long-term reanalyses (including MERRA-2) to understand the wind energy production in a patch of ocean off the coast of New York, ultimately deciding to purchase the rights to develop a wind farm there for €1B. At the meeting, wind energy users emphatically declared reanalyses as a key data resource in their planning procedures, but also pointed to the need for higher spatial resolutions and more boundary layer information. Near term plans for GMAO reanalyses were presented, with focus on the impending delivery of MERRA-21C - a 25km global reanalysis for the 21st century - and two of its key feautures. First, there will be a new boundary layer data collection, providing meteorology fields from the wind turbine hub height through 4000m above the surface on regular heigh levels. This should provide significant information on the interactions between the weather and surface and how it affects wind energy production. Second, MERRA-21C will also provide information from an ensemble observational analysis, which will provide one estimate of uncertainty in the near surface meteorology.
Early in the project planning for the first Modern Era Retrospective-analysis for Research and Applications (MERRA) it was recognized that the eventual data would be useful not only for research studies, but also the applied sciences - hence the A was introduced to the project title, circa 2002. Two major additions to the model component of the system were implemented to begin to address that goal. Firstly, surface meteorology and fluxes, followed by all two dimensional diagnostic fields written at the model grid, with 1 hourly frequency. This permitted a clearer representation of the diurnal cycle and the diurnal range (maxima and minima), as well as characterization of extreme events. In addition, discussions with applied scientists showed that the wind energy sector needed wind fields at or near their hub heights (~50m at that time). Neither of these features had been implemented in a global reanalysis at that time. As such, wind energy site planners began using reanalyses in earnest.
In the decades since, reanalyses have played significant roles in many studies that influence the energy sector. The NASA Langley project, Prediction Of Worldwide Energy Resources (POWER) connects more than 30000 users with NASA’s remote sensing observations and reanalyses. International reanalyses centers have followed by also providing hub height winds and hourly surface and meteorology data. Along with regional, dynamical and machine learning-aided downscaling efforts, wind energy planners now have multiple sources of hub height data, which permits uncertainty estimates in the eventual energy production.
Ultimately, the April 2024 meeting’s recommendation to the IEA was to consolidate all the energy needs from reanalyses (including solar energy and fossil fuels) since all the energy production can benefit from reanalysis data and there is need for coordination in understanding production, demand and distribution, considering disruptive weather and climate events. This meeting will likely result in a task team to help provide connections between the energy sector and reanalyses developers, and the novel data collection will foster significant research in surface – atmosphere interactions, increasing our understanding and guiding further model development.