


This webpage displays the rainfall and temperature characteristics for the last three decades over the Americas. Geographical distribution and time series of the values displayed on this webpage are climatology (seasonal & daily), rainfall frequency, temporal variation of the monthly precipitation in terms of the Standardized Precipitation Index (SPI), return values of extreme-related quantities from daily precipitation, and temperature extreme indices. The SPI is presented here to give an indication of what the precipitation amount is in relation to normal, and whether the individual locations experience wet/drought condition. Return values have been calculated for the daily maximum precipitation, the number of heavy rainfall events, the number of rainy days, and the consecutive dry days per season based on the Generalized Extreme Value (GEV) distribution. Please click the following list to be better informed about the concept of these values and the process of calculation.
Note: Please be aware that this atlas is a beta version. The atlas is still evolving as we learn more about the quality of the data and continue to add additional extreme parameters. We point out in particular that there are substantial regional difference in the quality of the reanalysis products with parts of South America showing considerably less (compare with North America) agreement in the precipitation and surface temperature fields among the reanalysis products and compared with observations (to the extent those are available). Please click Readmefirst for more information.
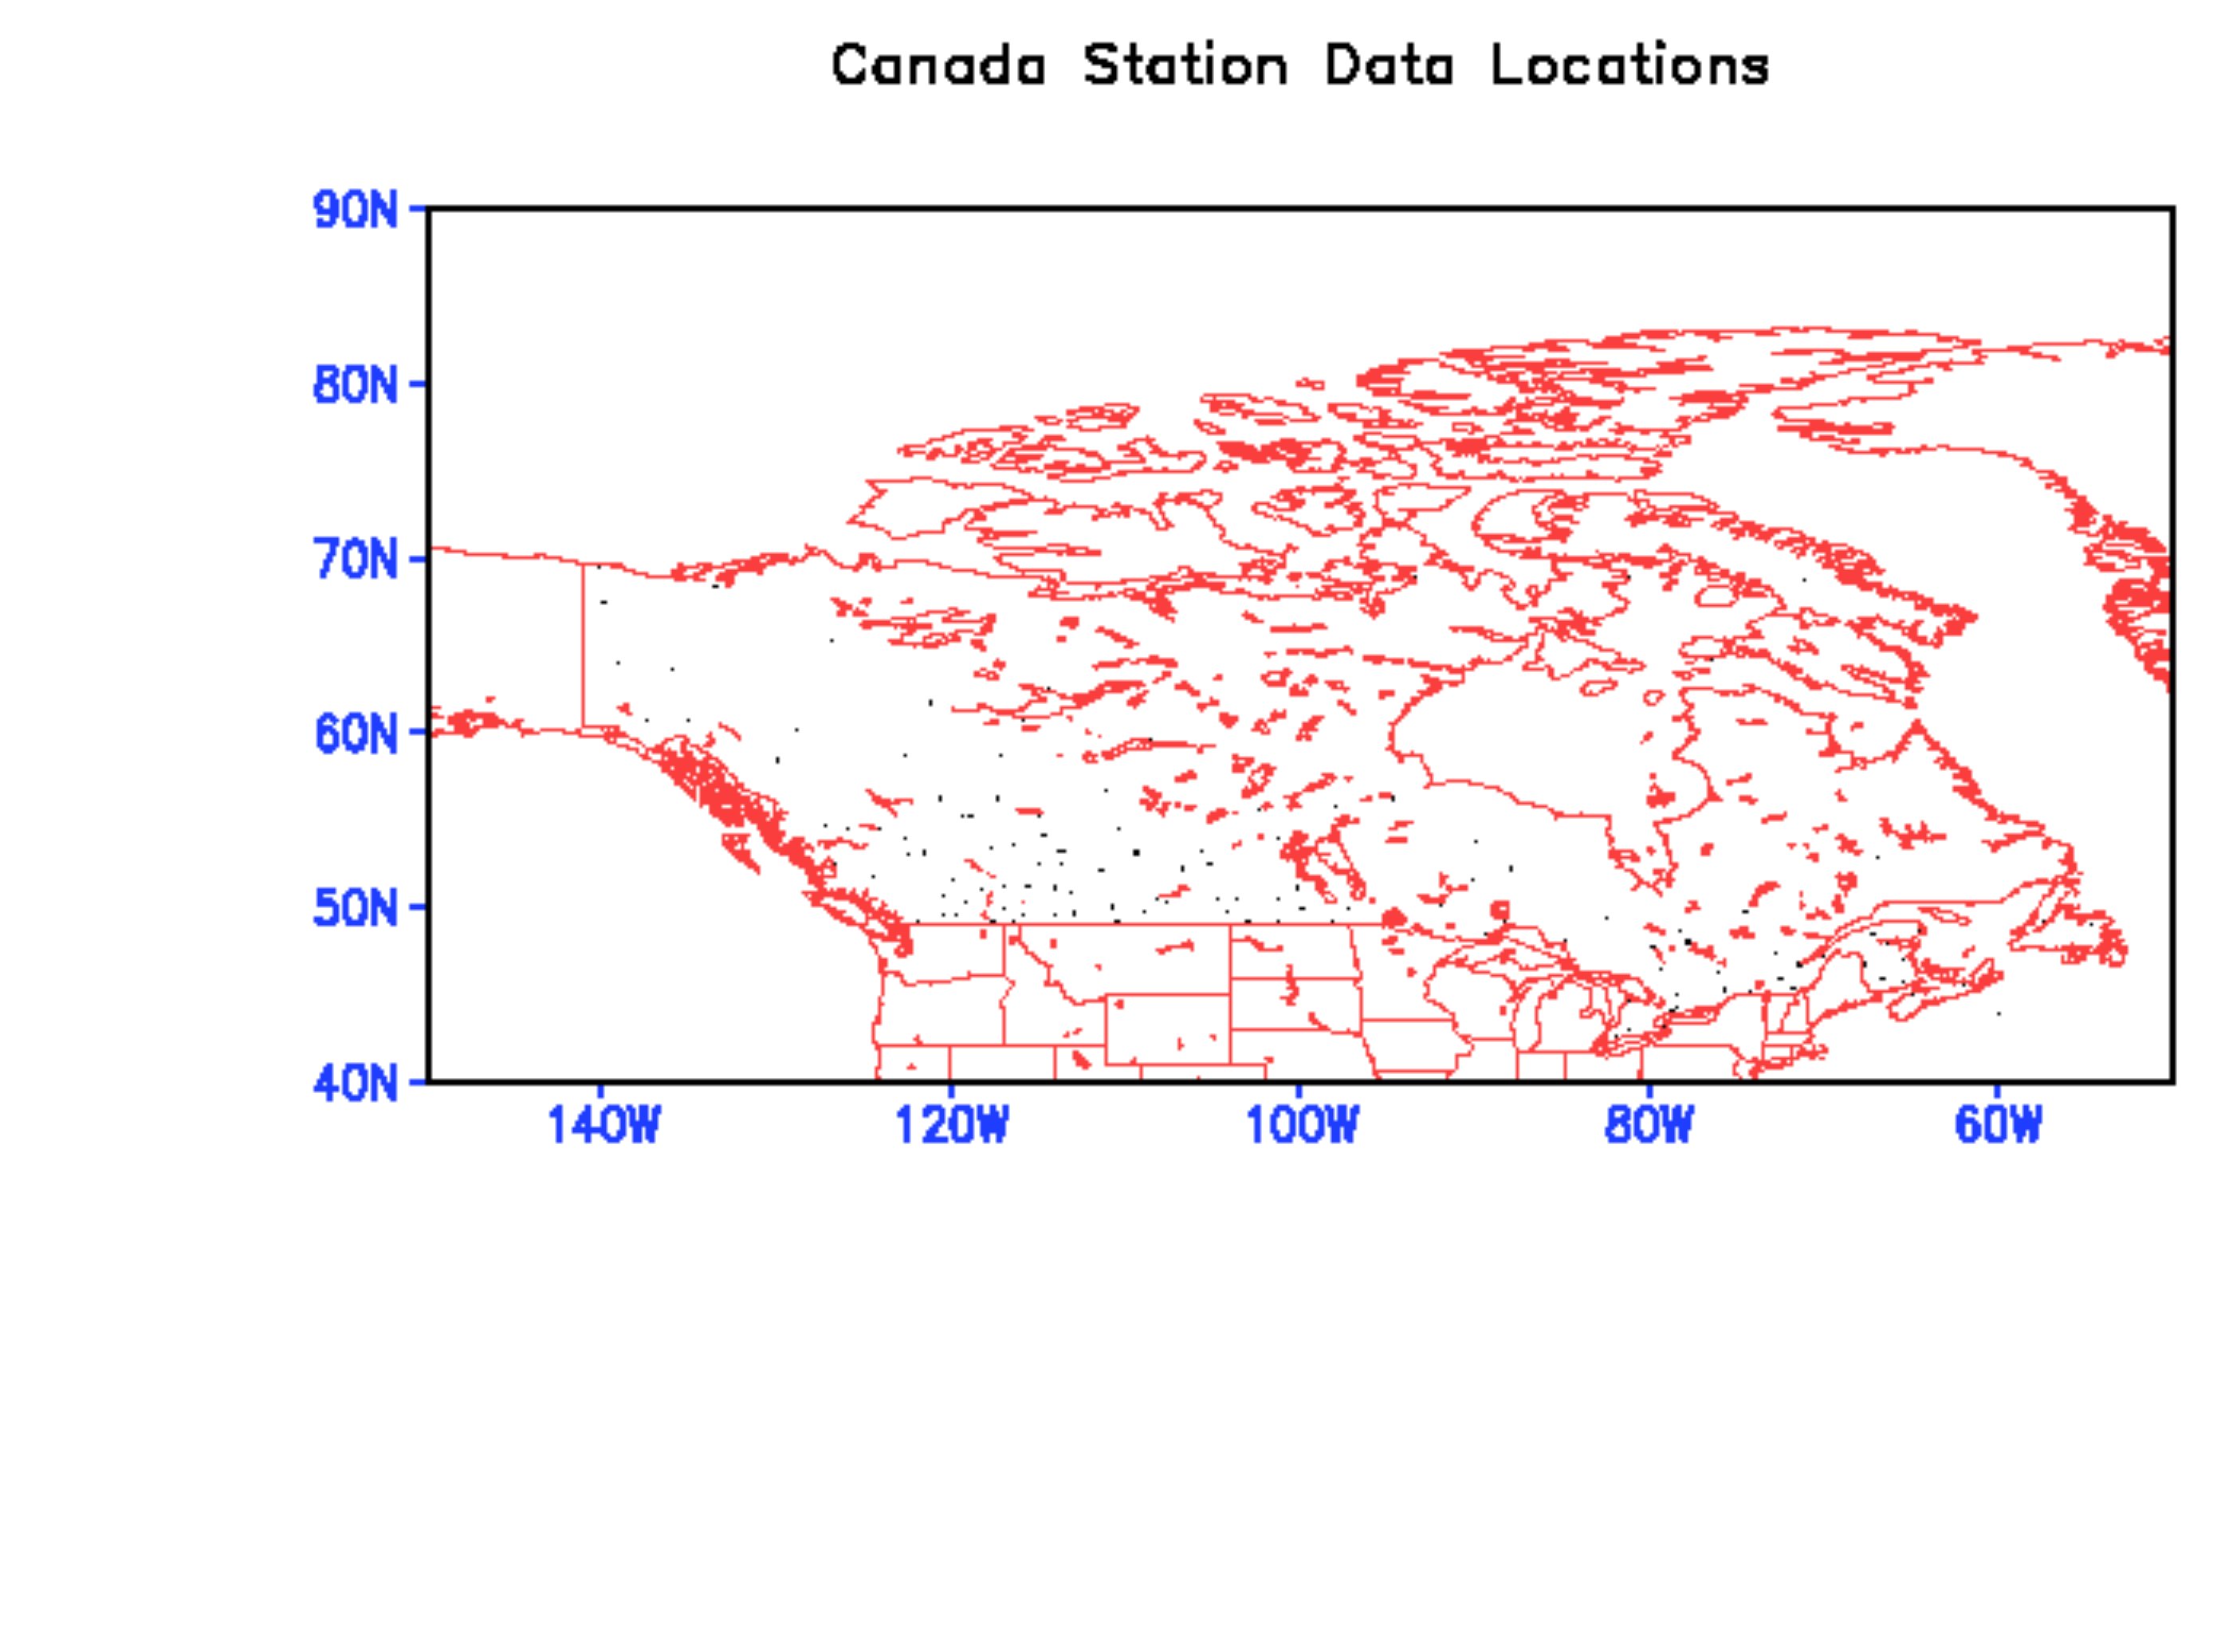
Environment Canada recently released daily temperature station obsevations. They consist of 210 station data with the period until Dec./2008. We calculated the temperature extreme indices using these data and the resulting patterns, as well as those from reanalysis, are available in Section 5. Please note that the temperature extreme indices calculated at individual stations were objectively analyzed to approximately 1.8 degree grids.
1. Mean fields
1.1 Seasonal climatology (Precipitation)
MERRA CFSR CPC (US&Mexico) CPC (SA) CDC (SA)
1.2 Seasonal climatology (Temperature)
MERRA (T mean, T max, T min) CFSR (T mean, T max, T min)
1.3 Daily precipitation climatology
1.4 Daily rainfall frequency
)
)
)
)
)
)
)
)
)
)
)
2. Precipitation extreme indices
2.1 The Number of Extreme Rain Days (Prcp. amount > 90% percentile) Maps
2.2 Maximum Length of Wet Spell (Max. number of consecutive rainy days (rain >= 1mm)) Maps
2.3 Maximum Length of Dry Spell (Max. number of consecutive dry days (rain < 1mm)) Maps
2.4 Simple Day Intensity Index (SDII) (The ratio of total rainfall to the number of rain days) Maps
3. Standardized Precipitation Index (SPI)
3.1 SPI maps
3.2 SPI time series
3.3 SPI plots for each season
3.3.1 MAM 3.3.2 JJA 3.3.3 SON 3.3.4 DJF
4. Generalized Extreme Value (GEV) and Return values
4.1 Return value maps
4.2 Return value maps in ENSO phases
4.2.1 El Niño years 4.2.2 La Niña years 4.2.3 Difference (El Niño - La Niña)
5. Temperature extreme indices
5.1 The Number of Warm Extreme Days (Tmax >= 90% percentile) Maps
5.2 The Number of Warm Extreme Days time series
5.3 The number of Cold Extreme Days (Tmin =< 10% percentile) Maps
5.4 The Number of Cold Extreme Days time series
5.5 Warm Spell Duration Index (WSDI) time series
5.6 Cold Spell Duration Index (CSDI) time series
5.7 The Number of Warm Extreme Nights (Tmin >= 90% percentile) Maps
5.8 The Number of Warm Extreme Nights time series
Datasets used:
Information on this webpage is as of 06/03/2011. This work is supported by the NASA MAP project "Simulating and Predicting Sub-seasonal and Longer-term Changes in Tropical Storm Characteristics using High-Resolution Climate Models" (PI: S. Schubert).
1. Modern Era Retrospective-analysis for Research and Applications (MERRA) (1979-2009) from NASA/GSFC/GMAO (0.667x0.5 degree resolution)
2. The Climate Forecast System Reanalysis (CFSR) (1979-2009) from NOAA/NCEP (T382(~0.3125 degree Resolution))
3. NOAA/NCEP/CPC gridded observation (1.0 degree resolution)
3.1 North America (US and Mexico) (1979-2009)
3.2 South America (1978-2007)
4. NOAA/CDC (Liebmann et al. 2005) gridded observation over South America (1979-2005) (2.5 degree resolution)
5. Environment Canada station observations (1979-2008) (Station distribution)
Please send suggestions or questions to Young-Kwon Lim or Siegfried D. Schubert.