Brief introduction of this atlas and general description about the limitation of the reanalysis (MERRA and CFSR) data: This is evolving research product for the Americas based on gridded observations and reanalysis products. It is intended for use by the climate and weather community to conduct research on extremes and to assess the utility of the reanalysis products for assessing extremes. It is very important to use the results with caution since the reanalyses have deficiencies, especially in the quantities considered here (precipitation and surface temperature) - quantities that are only weakly constrained by the observations and can therefore be strongly impacted by model bias. To help the users of these products we have tried to include comparisons of the extremes from independent observations where possible. We have also done some comparisons of monthly mean variability (computed spatial maps of correlations between the reanalyses and observations) to provide the user with a first cut at identifying regions where the reanalysis products cannot be trusted.
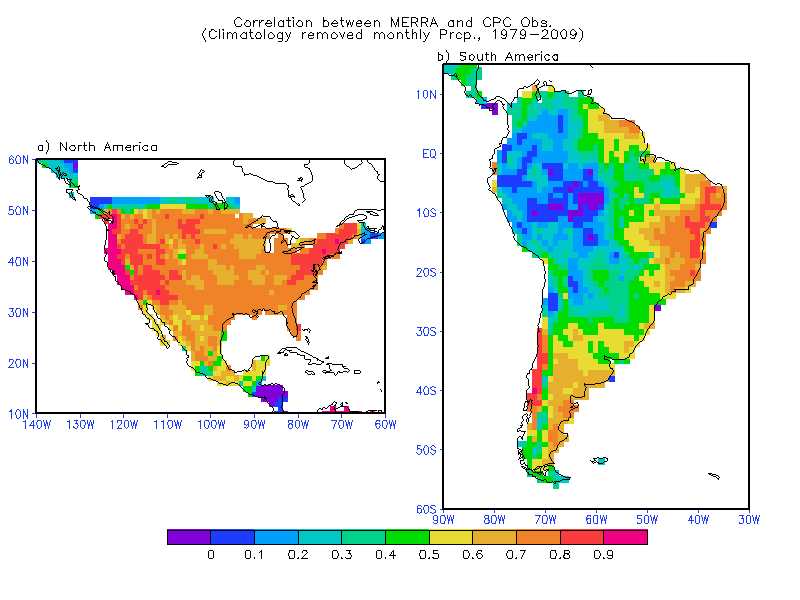
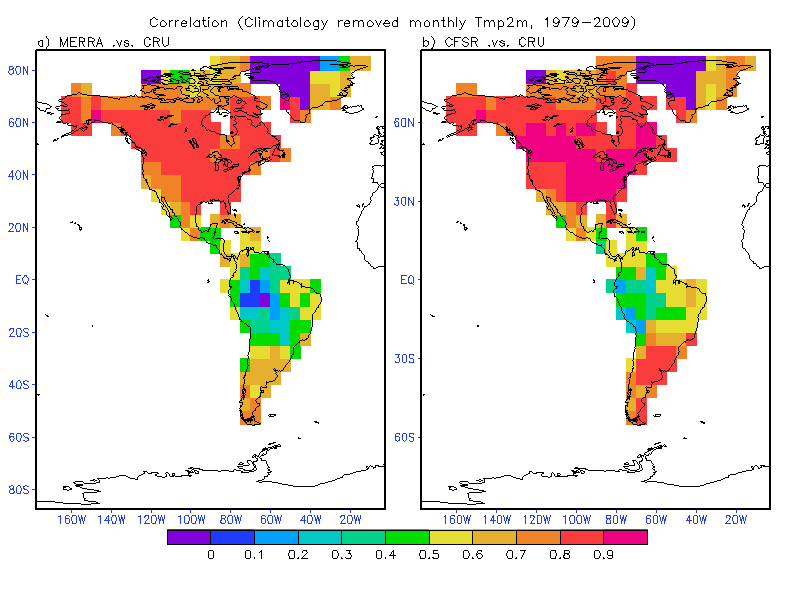
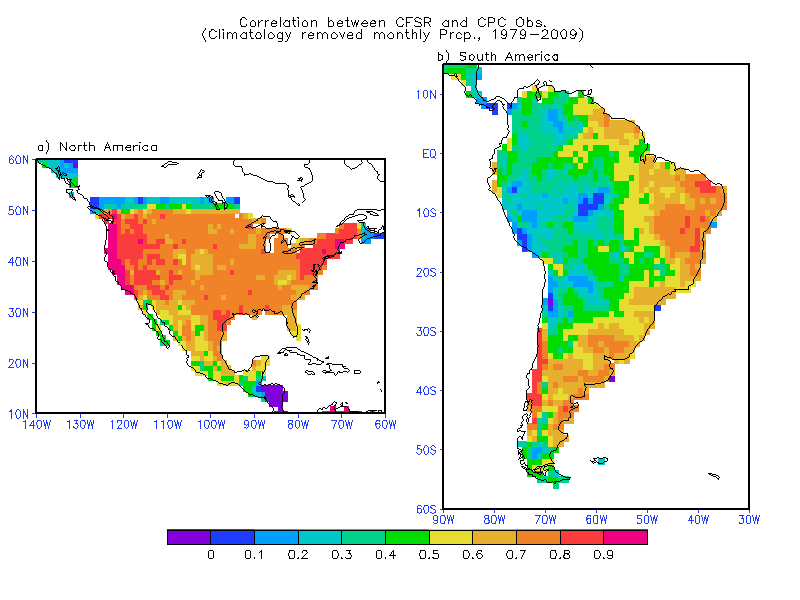
Specific description about the limitation of the reanalysis precipitation and surface air temperature: Data sources for the plots provided on this atlas are CPC (observations), CDC (observations), MERRA (reanalysis), and CFSR (reanalysis). Our initial evaluation found that the reanalysis data are especially deficient in reproducing the observed variability over parts of South America. The correlation maps (MERRA monthly precipitation and temperature), CFSR (monthly precipitation and temperature)) show considerably lower values over South America compared with North America, with the lowest correlations occuring over the Amazon and western South America. Users of this atlas are advised to have this limitation of the reanalysis data in mind when they view the figures for the South American region (especially for the regions enclosed by heavy black lines seen on the horizontal two-dimensional plots for sections 2 through 4). For the precipitation variable, we have posted the results based on observations (the extremes estimated from CPC and CDC) as well so that users can compare them with the reanalysis products. The corresponding temperature plots using the gridded daily observation data will also be posted as such data are acquired.