
Eclipse Across America: GEOS Cloud Predictions
08.18.2017 — updated 08.24.2017
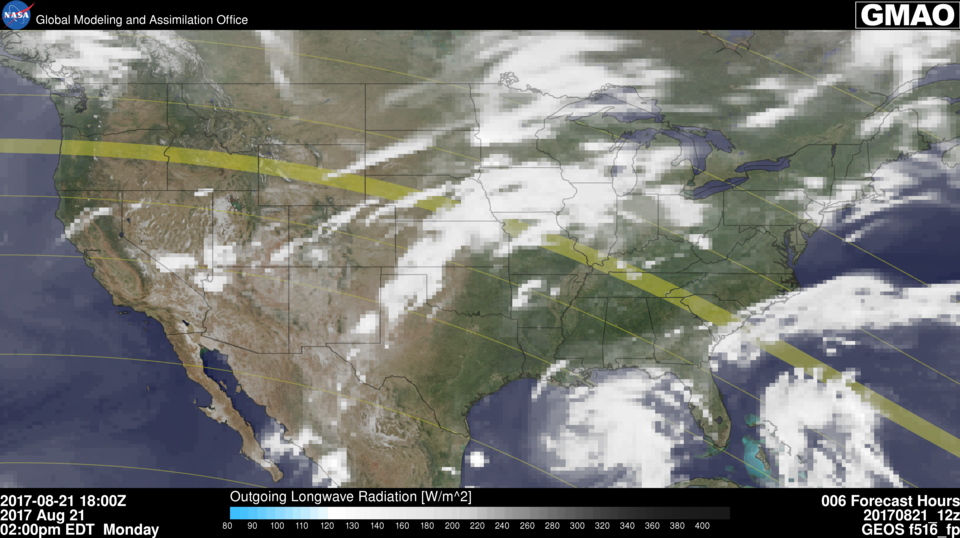
GMAO's Bill Putman created plots made from the GEOS FP model runs to suggest the areas of the US with and without predicted significant cloudiness at 1800hrs UTC on 21 August 2017. 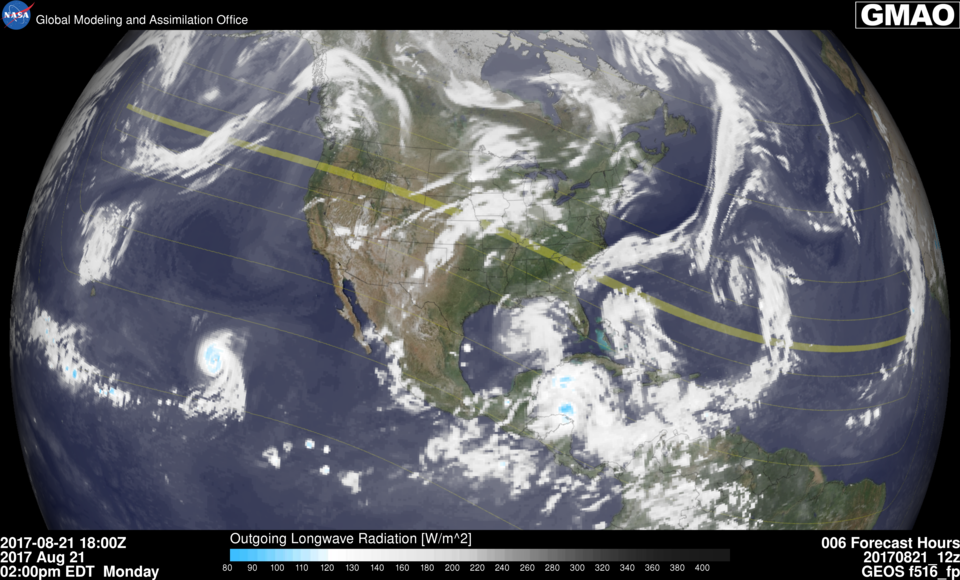
 These plots were updated twice each day.
These plots showed forecast fields from GMAO's GEOS assimilation and forecasting system. The plot showed the outgoing longwave radiation on a scale that emphasizes low values in blue and bright white - these bright colors coincide with the presence of cold cloud tops, compared to the more transparent regions where clouds are not present. The path of the eclipse was superposed on the cloud distributions: the full path of the eclipse including totality inside the yellow band, and the lines for 90%, 75%, 50% and 25% obscuration and the penumbra edge at 0%.
Within the caveats of such forecast cloud distributions being accurate, the transparent regions along the path of the eclipse were the locations where the sun was most likely to be visible from the ground.
Because the eclipse crossed the US within less than three hours, the plots shown were valid for 2 p.m. EDT (1800 UTC) on Monday August 21. No attempt was made to interpolate the cloud fields from the hourly data files that are archived from GEOS.
Thanks to Bill Putman for creating these plots and to Austin Conaty for his technical assistance in presenting the updated plots.