
The Recipe for an Active Atlantic Hurricane Season
08.31.2017
In order to have an active hurricane season in the Atlantic, three key components — sea surface temperature, wind structure, and atmospheric pressure — have to be just right.
First is the sea surface temperature. When the temperature of the Atlantic Ocean north of the equator is warmer than average (e.g., warm phase of the Atlantic Meridional Mode), hurricanes are more likely to form. If the temperature is cooler, hurricane formation is less likely.
ENSO (El Niño or La Niña) in the Pacific Ocean is also a very important factor to determine the distribution of the three key components. For instance, the El Niño and La Niña affects the sea level pressure and the wind strength in the Atlantic. La Niña provides better wind conditions to create a hurricane. The winds during an El Niño year tend to shear off the tops of hurricanes, which can weaken or effectively kill them.
The third component is atmospheric pressure. If the pressure difference between a low-pressure system in the subpolar region and a high-pressure system near the subtropical region is greater than average, the wind conditions are not favorable for a hurricane to form (positive phase of the North Atlantic Oscillation). On the other hand, if the difference between the two are lower than average, hurricane formation is more likely.
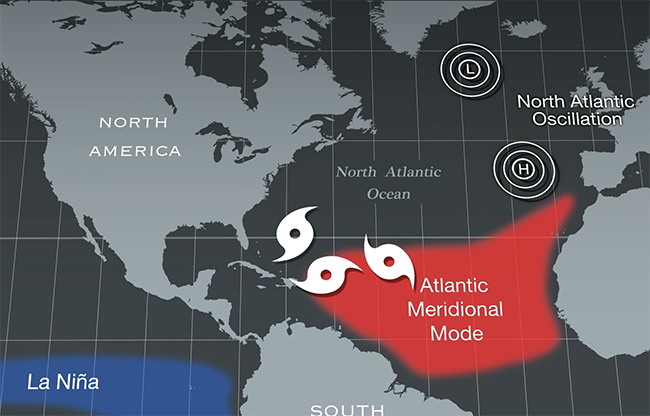
Hurricane activity is strong during La Niña, the warm phase of the Atlantic Meridional Mode, and the negative phase of the North Atlantic Oscillation, when both the subtropical high (H) and sub-polar low (L) are weaker than average.
These parameters are just part of what scientists use to create their hurricane models. If the conditions change, a once favorable hurricane season in the Atlantic could turn into a less favorable one. The number of tropical cyclones and their track are very sensitive to the relative phases and intensities of these three parameters, and not just to ENSO alone. The year 2005, 2006, and 2013 are examples that extremely strong or weak hurricane activity occurred in those years are not simply explained by their ENSO phases alone.
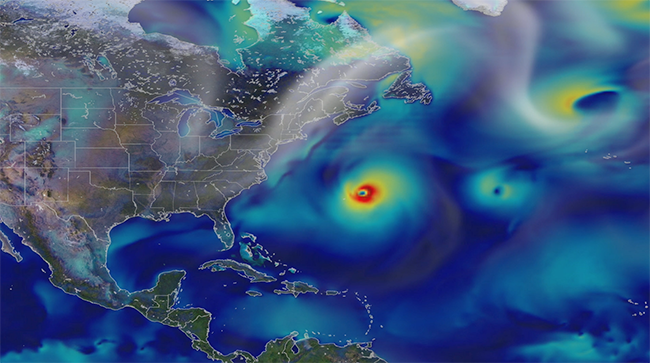
Scientists can analyze the structure and lifecycle of severe storms using weather prediction models and incorporate what they learn into newer models. This will hopefully result in even more accurate hurricane forecasts in the future. This image shows surface wind speeds, as simulated by GEOS, for Hurricane Leslie in early September 2012, more than a month before Hurricane Sandy made its way up the East Coast. Wind speeds range from approximately 10 miles per hour (15 kilometers per hour), shown as dark blue up to 70 and 80 miles per hour, shown as dark reds and light purples, respectively.
To view the animation, please visit: https://svs.gsfc.nasa.gov/12628.