|
Eyring, V., D.W. Waugh, G.E. Bodeker, E. Cordero, H. Akiyoshi, J. Austin, S.R. Beagley, B.A, A. Gettelman, M.A. Giorgetta, D.E. Kinnison, E. Mancini, E. Manzini, D.R. Marsh, S. Matthes, T. Nagashima, P.A. Newman, J.E. Nielsen, S. Pawson, G. Pitari, D.A. Plummer, E. Rozanov, M. Schraner, J.F. Scinocca, K. Semeniuk, T.G. Shepherd, K. Shibata, B. Steil, R.S. Stolarski, W. Tian, and M. Yoshiki
Begin Main Content
Projections of the state of ozone
through the 21st Century and its interactions with climate have been
made in a collaborative study between the GMAO and the Atmospheric Chemistry
and Dynamics Branch (Code 613.3). Ozone change in this period is impacted by
two factors. The first is the derease in stratospheric chlorine
concentrations following international protocols that prohibit CFC production
in isolation, this would lead to a "recovery" of ozone to levels typical of the
middle part of the 20th Century. The second is the temperature
change induced by greenhouse gas increases: the cooling of the stratosphere
associated with these changes leads to an increase in ozone because of the
temperature-dependence of chemical reactions. The situation is complicated by
the fact that ozone contributes to the Earth's energy balance by absorbing
solar radiation and emitting and absorbing at in the thermal infrared.
Interactions between ozone and climate are thus complex, meaning that coupled
chemistry-climate models (CCMs) are the only tools suitable for studies of
ozone change over decadal to centurial timescales.
The GEOS-CCM couples the GMAO's "GEOS-4" general circulation model
with a stratospheric chemistry model developed in Code 613.3;
it is being used for studies of interactions between ozone and
climate. As part of a WCRP-SPARC initiative, CCMVal, the GEOS-CCM has been run
using sea-surface temperatures and ice distributions from an "IPCC AR-4"
integration of the Hadley Centre's "HADGEM1" climate model. Greenhouse-gas and
halogen (chlorine, bromine, etc.) emissions follow established international
protocols. The evolution of ozone and a number of other trace gases is being
studied.
 (click on image to enlarge)
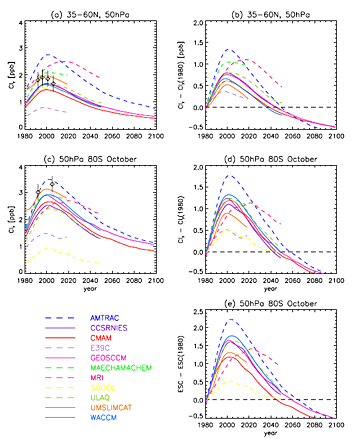
Caption (Figure 1 of Eyring et al., 2007). Zonal mean values of total inorganic chlorine (Cly in ppb) at 50 hPa for (a) annual mean 35-60°N and (c) October at 80°S. (b and d) Difference in Cly from that in 1980. (e) Difference in equivalent stratospheric chlorine (ESC) (Cly + 60Bry) from that in 1980. Solid and dashed curves show smoothed data derived by applying a 1:2:1 filter iteratively 30 times. Symbols in Figures 1a and 1c show observational estimates of Cly.
The GEOS-CCM is one of eleven models that have been evaluated in CCMVal. Simulations of the ozone evolution
through the 21st Century arcompared in a paper by Eyring et al.
(2007). Despite differences in the rates of change in ozone in the past and
through the 21st Century, the study concludes that the underlying
causes of ozone change are understood. It is the evolution of halogen amounts
in the stratosphere that determine the ozone change: models with unrealistic
growth and decay in stratospheric (inorganic) chlorine show corresponding
discrepancies in their ozone evolution. The GEOS-CCM is one of the models
whose transport properties, meteorological state, and chemical components are
all sufficiently realistic to make credble predictions of ozone. One
important aspect of the GEOS-CCM is that ozone is biased high when the chlorine
loading is low, meaning that the magnitude of decrease and recovery is
overestimated, even though its temporal behavior seems consistent with
observations of the past 30 years.Ozone is expected to recover to values
typical of "1980" (before the significant build-up of chlorine and other
halogens) in the 2035-2050 period.
 (click on image to enlarge)
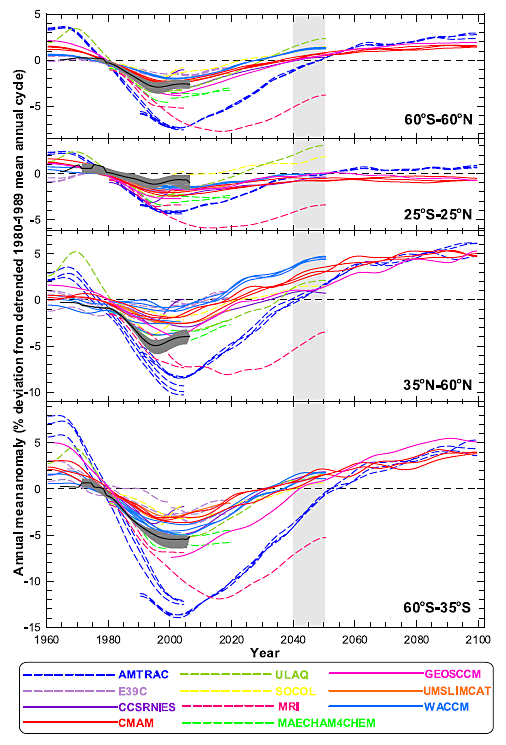
Caption (Figure 5 of Eyring et al., 2007). Annual mean zonal mean total column ozone anomalies from CCMs (colored lines) and from four observational data sets (thick black line and gray shaded area show the mean and range of observed anomalies). Four observational data sets are taken from ground-based measurements (updated from Fioletov et al. [2002]), merged satellite data [Stolarski and Frith, 2006], the National Institute of Water and Atmospheric Research (NIWA) assimilated database [Bodeker et al., 2005], and from Solar Backscatter Ultraviolet (SBUV, SBUV/2) retrievals (updated from Miller et al. [2002]). Area-weighted zonal mean time series are shown for the extrapolar region (60°S to 60°N), the equatorial region (25°S to 25°N), the northern midlatitude region (35°N to 60°N), and the southern midlatitude region (60°S to 35°S). Observational time series have been smoothed as in Figure 1. Light gray shading between 2040 and 2050 shows the period when stratospheric concentrations of halogens are expected to return to their 1980 values. Monthly anomalies were calculated by subtracting a detrended mean annual cycle, calculated over the period 1980-1989, from each time series. Annual cycle was detrended by fitting a regression model with seasonally dependent trends to the data and reconstructing the “1980” mean annual cycle using the stationary components of the regression model. For further details on the method for calculating the anomalies see Eyring et al. [2006].
Reference
Eyring, V., D.W. Waugh, G.E. Bodeker, et al., Multimodel projections of stratospheric ozone in the 21st century. J. Geophys. Res., 112, D16303, 10.1029/2006JD008332
|