
Verifying GEOS-5 sulfur dioxide simulations
V. Buchard and A. da Silva September 2013
Sulfur dioxide (SO2) gas is chiefly emitted by anthropogenic sources. Near the surface it is harmful to human health. It is also a precursor to acid rain and to sulfate aerosols, which impact cloud microphysics and radiative forcing. The ability to accurately model SO2 in the atmosphere therefore can contribute to health and safety management applications. In November 2010, a field campaign in Frostburg, Maryland afforded the GMAO an opportunity to evaluate the simulation of SO2 in our GEOS-5 model.
GEOS-5 uses an aerosol transport module based on the Goddard Chemistry Aerosol Radiation and Transport (GOCART) model to simulate major tropospheric aerosol types, like sulfate, dust, organic and black carbon, and sea salt. In the module, sulfur chemistry is based on the work of Chin et al. (2000), naturally occurring sources of SO2 emissions are included, and anthropogenic emissions of SO2 are taken from prescribed observational datasets. In this study, GEOS-5 was run with a 25 km horizontal resolution with 72 vertical levels from the surface up to about 80 km in altitude. Two different types of simulations were run to examine the model's representation of SO2 and sulfate aerosols: a control run that injected sulfur emissions (taken from Streets et al. (2009)) directly into the lowest model layer, and a revised run that used a new Emission Database for Global Atmospheric Research (EDGAR, European Commission, 2010), which allowed emissions to be injected into either the lowest model level or higher layers, depending on the emission source. For full experiment details and information on emissions and emissions sources, see Buchard et al. (2013).
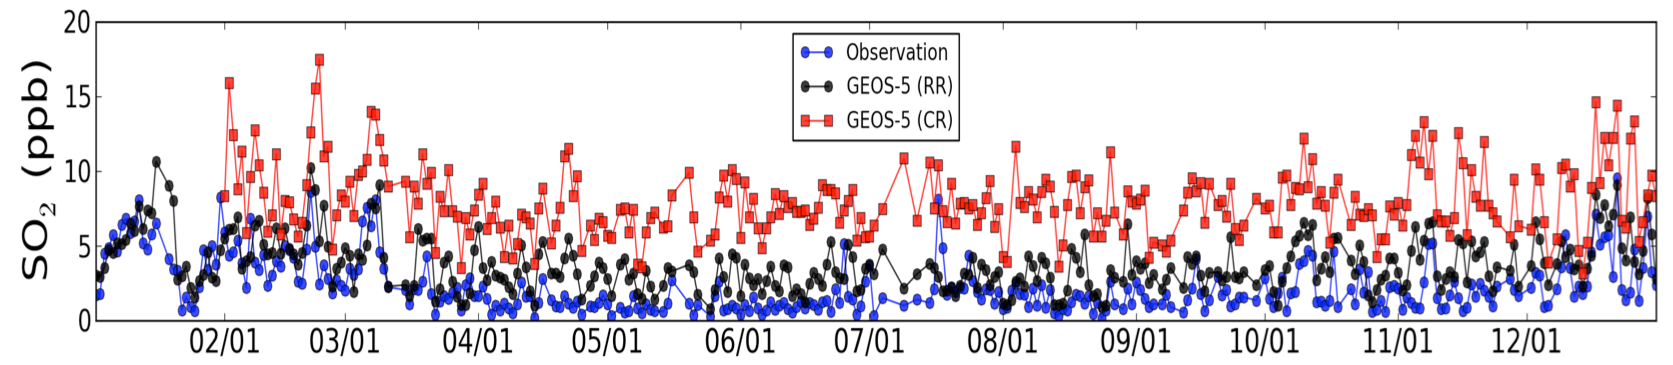
Figure 1 shows results from comparisons of daily mean SO2 concentrations between model runs and observed daily averages calculated from 102 Environmental Protection Agency (EPA) Air Quality System (AQS) sites in the U.S. The data for both the model and the observations was logarithmically transformed before correlation coefficients, root mean squares of the differences, and standard deviations were calculated. Generally speaking, the revised model run had more agreement with observations than the control run. Agreement between the model and observations was further improved by using an "adaptive buddy check" (Dee et al., 2001) to filter out observations that were too dissimilar from their neighbors. Biases in the model results still exist, however. When comparing modeled SO2 with observed SO2 from a sampling station during the 2010 Frostburg field campaign, the control run overestimated SO2 by a factor of 4-5, and though the results were much better in the revised run, they were still high (Figure 2). This bias is likely due to the fact that anthropogenic SO2 emissions were substantially higher in 2005, the year on which the EDGAR dataset is based, than they were in 2010, when the field campaign against which we were verifying model results took place.
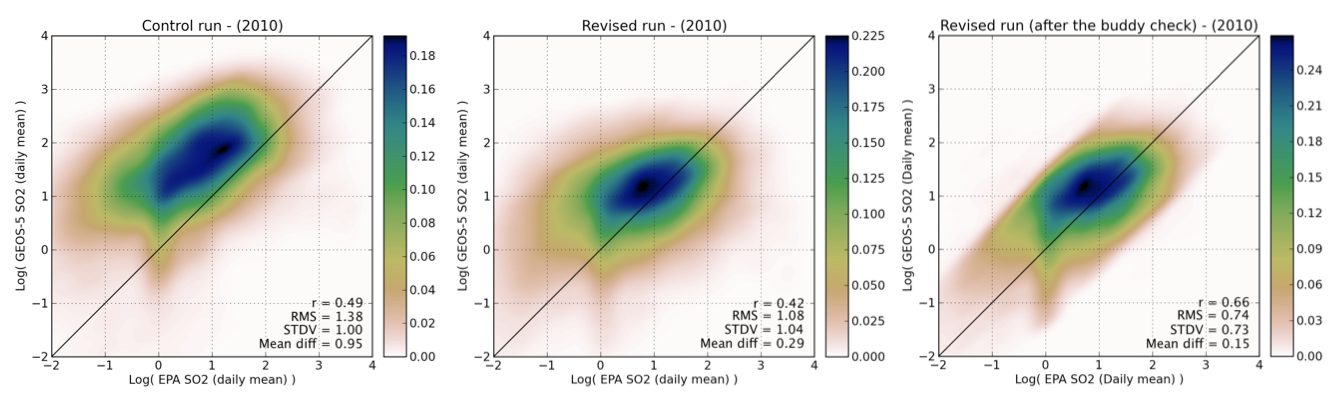
click for larger image
Similar to results for SO2 concentrations, daily mean values for modeled sulfate aerosols were also found to be higher than those observed at 250 EPA AQS sites, though correlations between model results and observations were just slightly better in the revised runs with the adaptive buddy check than they were in the control run. The similarity of the statistics between model runs, however, suggests that the details of SO2 emission injection into the model have a low impact on sulfate aerosol comparisons. The high model bias for sulfate, and the fact that the mean lifetime of SO2 in GEOS-5 has been found to generally be longer than that observed (implying that the production of sulfate is slower in the model), suggest that GEOS-5 may also be underestimating the loss of sulfate aerosols.
click for larger image
Additional comparisons of observations from a single site during the field campaign and model results revealed that while GEOS-5 was satisfactorily simulating SO2 column amount, the model was unable to reproduce observed diurnal variations. This is likely due to a lack of diurnal variation in the prescribed SO2 emissions datasets and to the larger spatial resolution of the model. GEOS-5 was also able to satisfactorily reproduce vertical profiles of SO2 in both the control and revised runs—the model was able to capture many of the variations in vertical profiles of SO2 observed on flights during two days of the field campaign. On the day that the model performed best at representing the vertical distribution of SO2, winds were strong, allowing for ample mixing throughout the area. While the model reproduced many variations in the vertical profile of SO2 on the second day, GEOS-5 missed observed high values of SO2 on the flight track. The prevailing winds were lighter on this day, and mixing less prevalent. The lack of agreement between GEOS-5 and observations in this instance can also be attributed to the fact that the region of elevated SO2 was small compared to the spatial resolution of the model.
Overall, GEOS-5 was able to simulate SO2 well in this study. High biases in SO2 concentrations at the surface were present, but results were significantly improved by allowing for SO2 emissions to be injected at various vertical levels of the model in the revised run. High model biases of sulfate aerosols, however, suggest that the loss of sulfate may be underestimated in the model. Further work is needed to thoroughly understand why this may be.
References:
Buchard-Marchant, V., A. M. daSilva, P. Colarco, N. A. Krotkov, R. R. Dickerson, J. W. Stehr, G. Mount, E. Spinei, H. L. Arkinson, and H. He, 2013: Evaluation of GEOS-5 sulfur dioxide simulations during the Frostburg, MD 2010 field campaign. Atmos. Chem. Phys. (Submitted)
Chin, M., R. B. Rood, S. J. Lin, J. F. Müller, A. M. Thompson, 2000: Atmospheric sulfur cycle simulated in the global model GOCART: Model description and global properties. J. Geophys. Res., 105, 24671-24678. doi: 10.1029/2000JD900384
Dee, D., L. Rukhovets, R. Todling, A. daSilva, J. Larson, 2001: An adaptive buddy check for observational quality control. Quart. J. Roy. Meteor. Soc., 127, 2451-2471.
European Commission: Joint Research Centre / Netherlands Environmental Assessment Agency, 2010: Emission Database for Global Atmospheric Research, version 4.1. Available online at: http://edgar.jrc.ec.europa.eu.
Streets, D. G., F. Yan, M. Chin, T. Diehl, N. Mahowald, M. Schultz, M. Wild, Y. Wu, C. Yu, 2009: Anthropogenic and natural contributions to regional trends in aerosol optical depth. J. Geophys. Res., 114, 1980-2006. doi: 10.1029/2008JD011624