

Modern-Era Retrospective analysis for Research and Applications, Version 2
MERRA-2 Data Cube Page
The Modern-Era Retrospective Analysis for Research and Applications, Version 2 (MERRA-2) is the latest atmospheric reanalysis of the modern satellite era produced by NASA’s Global Modeling and Assimilation Office (GMAO). MERRA-2 incorporates observation types not available to its predecessor, MERRA, and includes updates to the Goddard Earth Observing System (GEOS) model and analysis scheme to provide an advanced product suite suitable for weather and climate applications.
MERRA-2 is a long-term record of global atmospheric analyses, beginning in 1980. It was introduced to replace the original MERRA dataset because of the advances made in the assimilation system that enable use of modern hyperspectral radiance and microwave observations, among other data types. Additional advances in both the Goddard Earth Observing System (GEOS) model and the Gridpoint Statistical Interpolation (GSI) analysis technique are included. MERRA-2 takes some significant steps toward the GMAO’s target of an Earth System reanalysis. With its assimilation of the long-term observational record of atmospheric aerosols, MERRA-2 is the first long-term global reanalysis to represent aerosol impacts on other physical processes in the climate system. MERRA-2 sustains GMAO’s commitment to having an ongoing near-real-time climate analysis.
The six square data images shown below and on the data cube illustrate the cubed sphere grid used in the GEOS model that helps improve the representation of the polar regions compared to traditional latitude-longitude grids. On the back of the printed card are overviews of the six different data sets shown here.
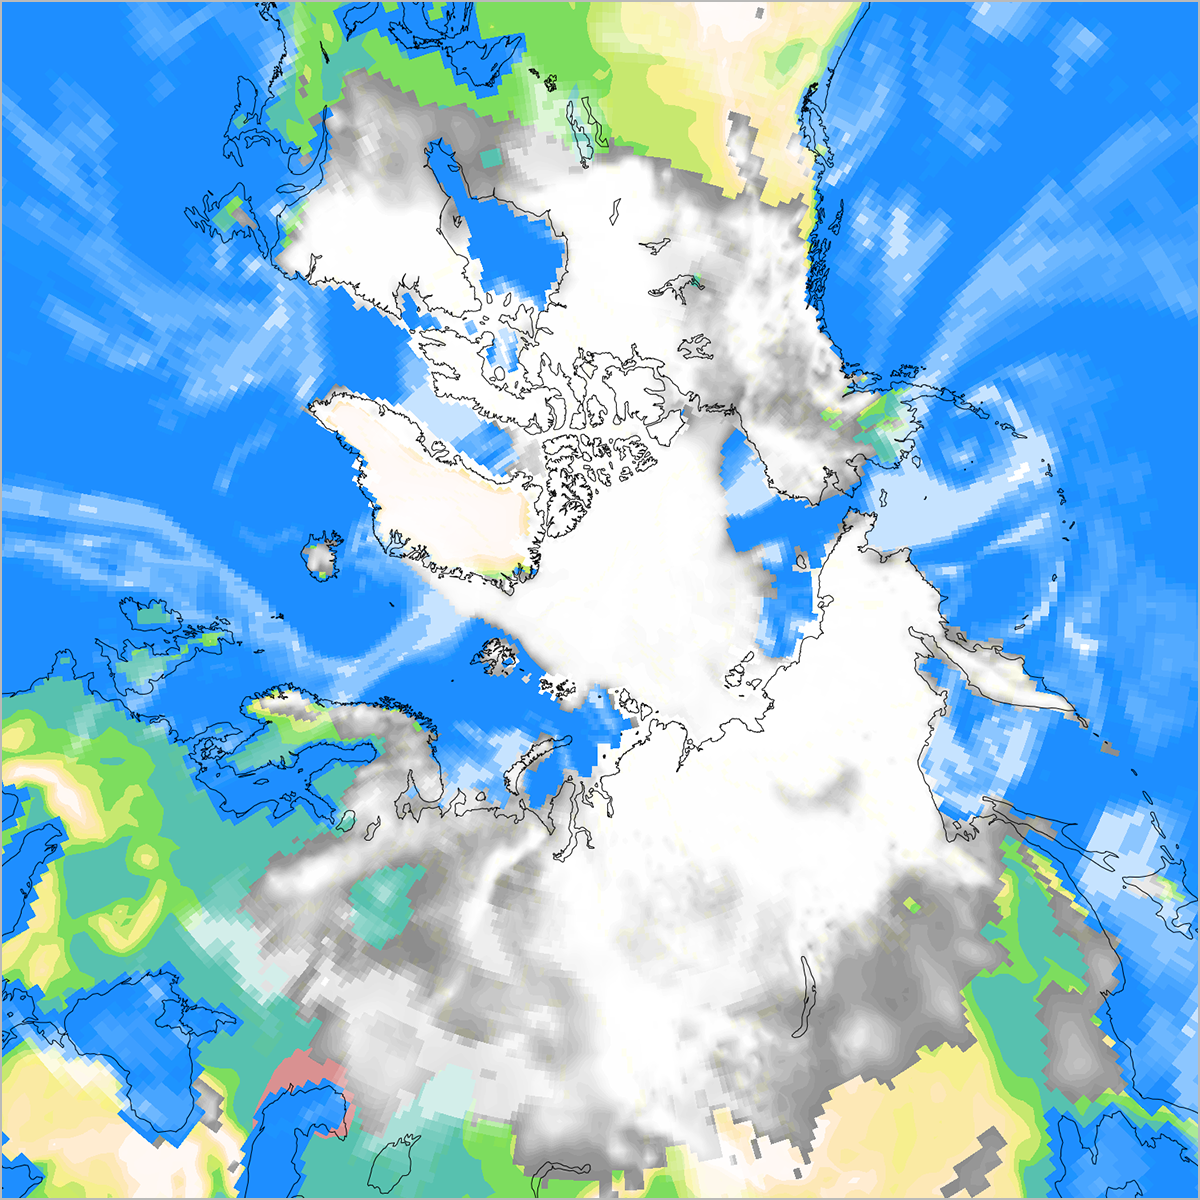
ARCTIC
Topography and fraction of area covered by sea ice, snow, and (middle) clouds for October 31, 2016. The Arctic is a semi-enclosed ocean, almost completely surrounded by land. Its average maximum sea ice areal extent is around 6,000,000 square miles and its minimum is about 2,510,000 square miles.
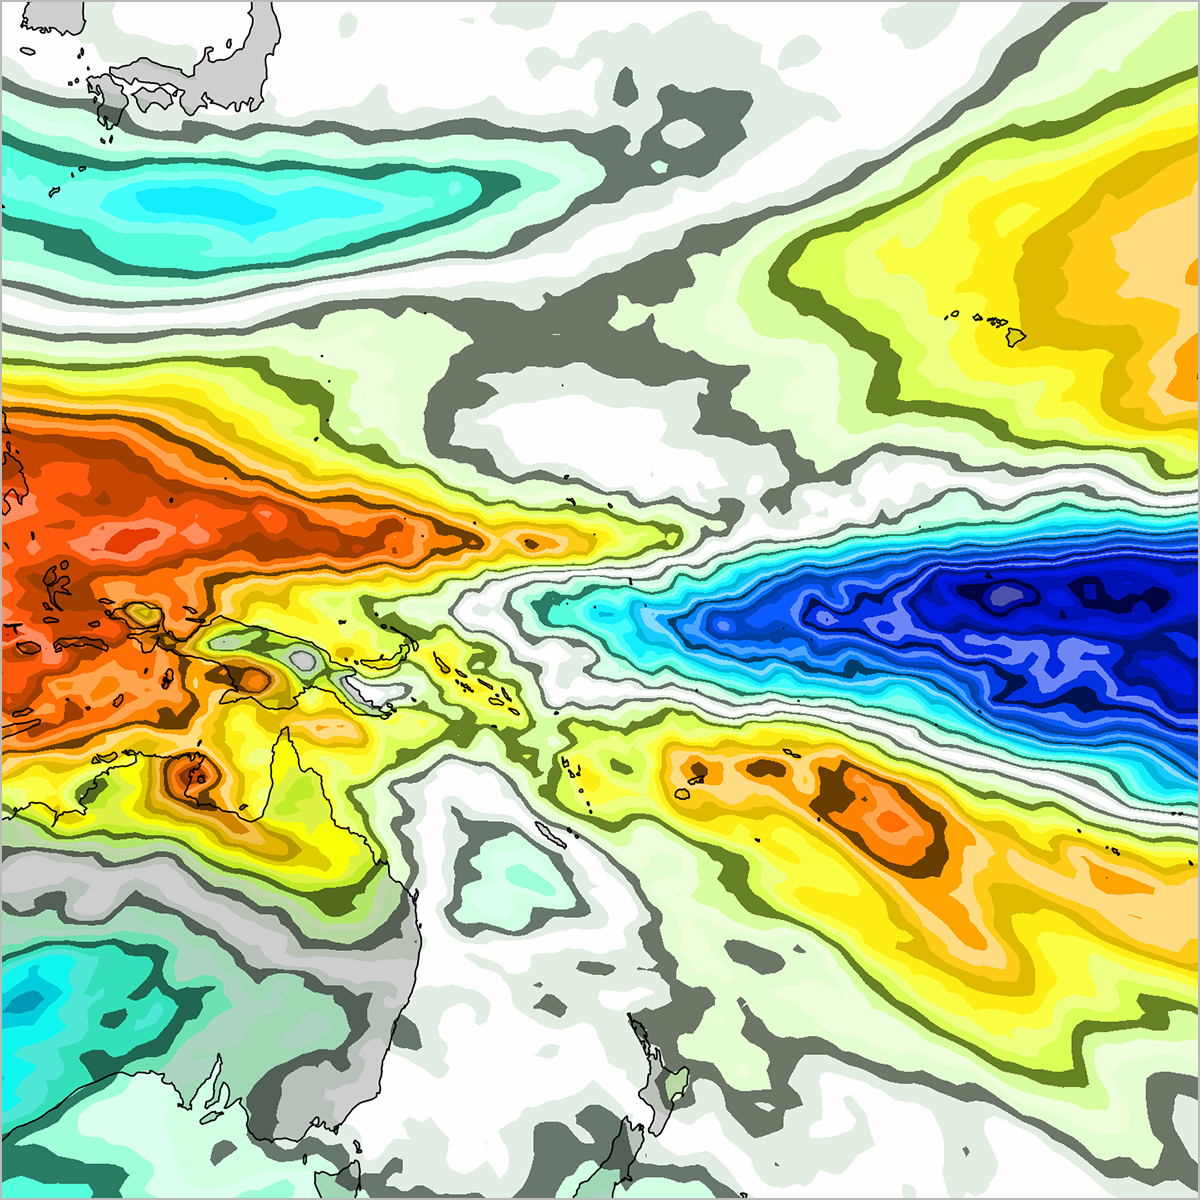
PACIFIC
Top-of-atmosphere outgoing longwave radiative flux anomaly for December-February 1982-83. Cooler colors in this image indicate lower values of the longwave radiative flux than normal, and hence more and higher clouds. Warmer colors indicate fewer clouds than average. The Pacific Ocean has a surface area of over 60 million square miles. The average depth of the Pacific is 14,040 feet (4,280 meters), and the deepest is in the Mariana Trench, 36,201 feet (11,034 meters).
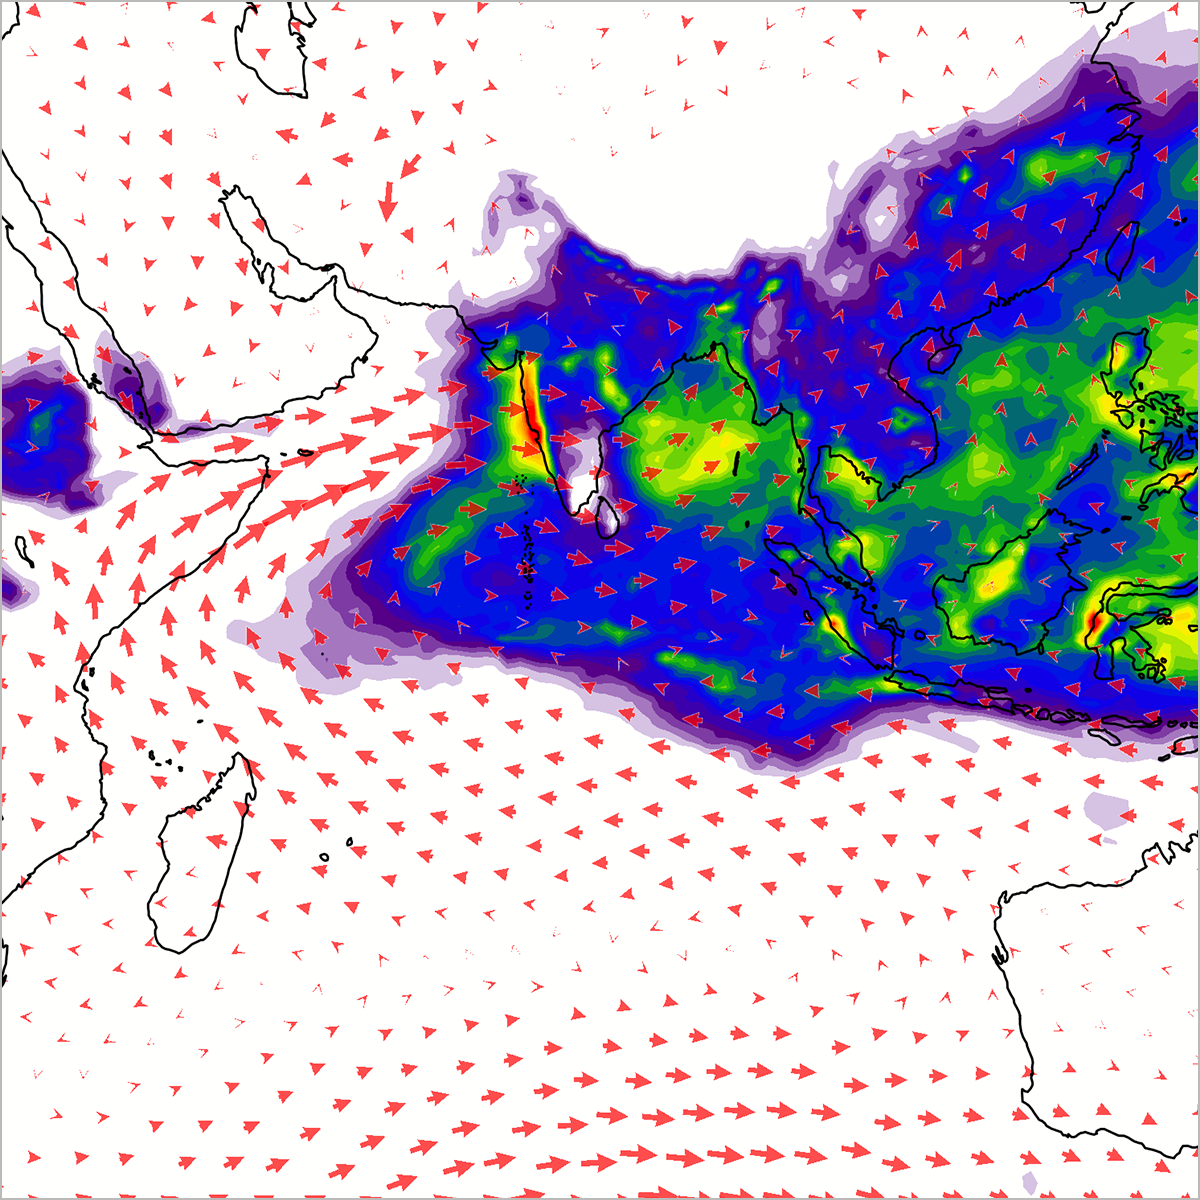
ASIA
Convective precipitation and 850 hPa (hectopascal) winds for July 2010. Warmer colors indicate more convective precipitation associated with the south Asian monsoon wet season. The size of the arrows indicates stronger winds. The windfield highlights the low-level Somali jet, which pushes moist air towards southwestern India. As the largest continent on Earth, Asia covers over 17,200,000 square miles of area. Being the tallest mountains in the world, the Himalayas affect the air and water circulations. They mountain range prevents the cold winter continental air from moving south into India and the monsoon rain and winds from moving north into Tibet.
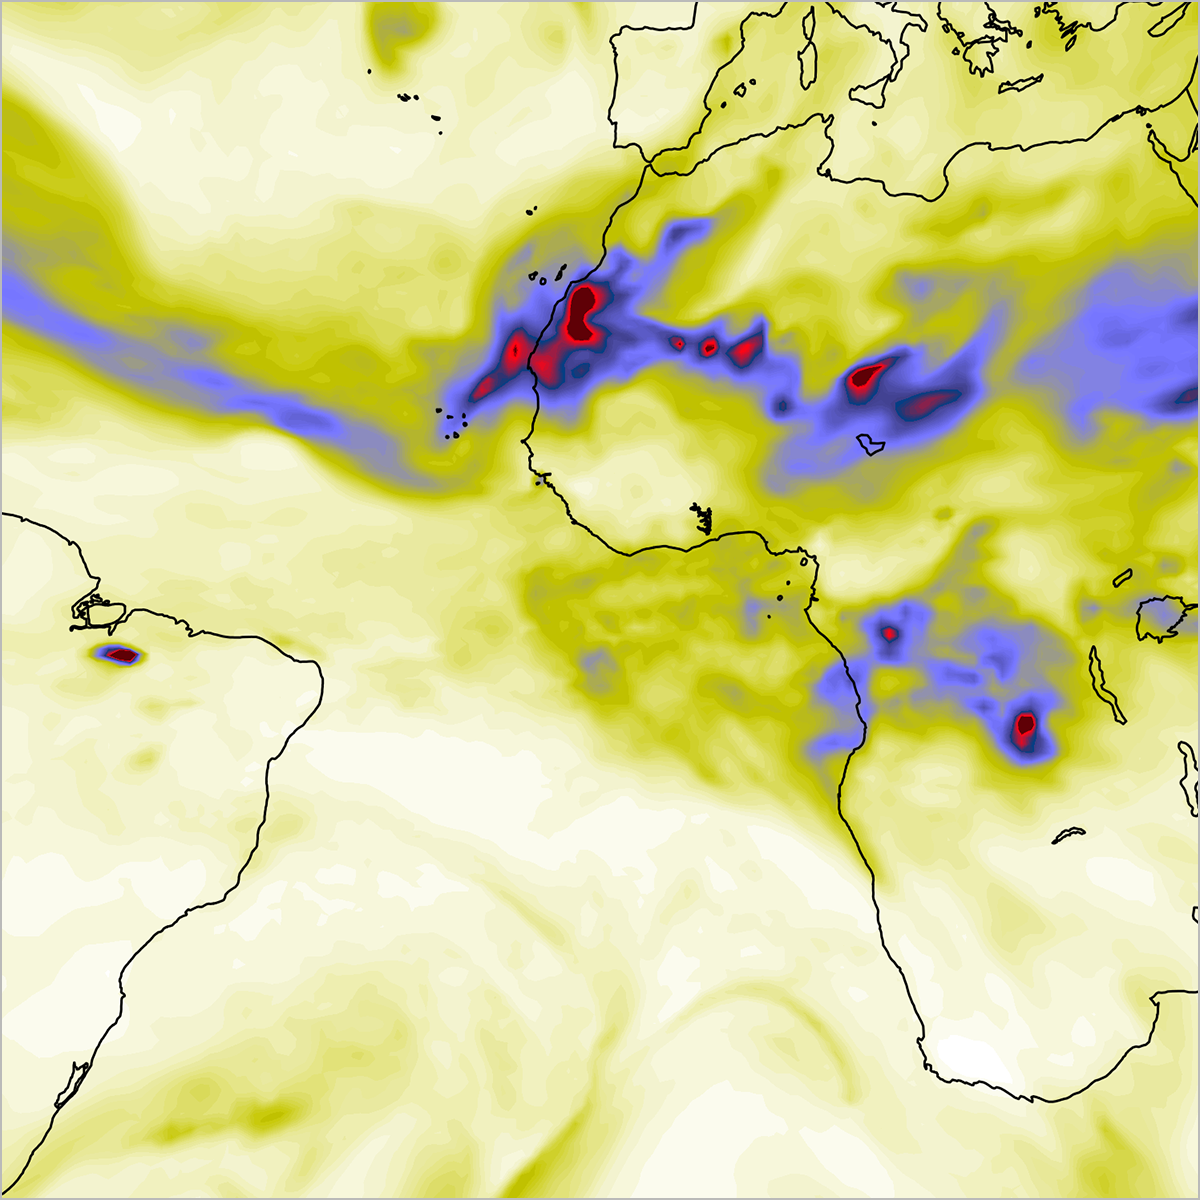
AFRICA
Aerosol optical depth for July 21, 2012. Yellows and greens indicate a lower aerosol optical depth, while blues and reds indicate larger values. Aerosol particles can come from large fires, desert winds, ocean waves, volcanoes, and pollution from urban areas and industrial sources. Sahara Desert dust is able to blow across the Atlantic Ocean to the Americas.
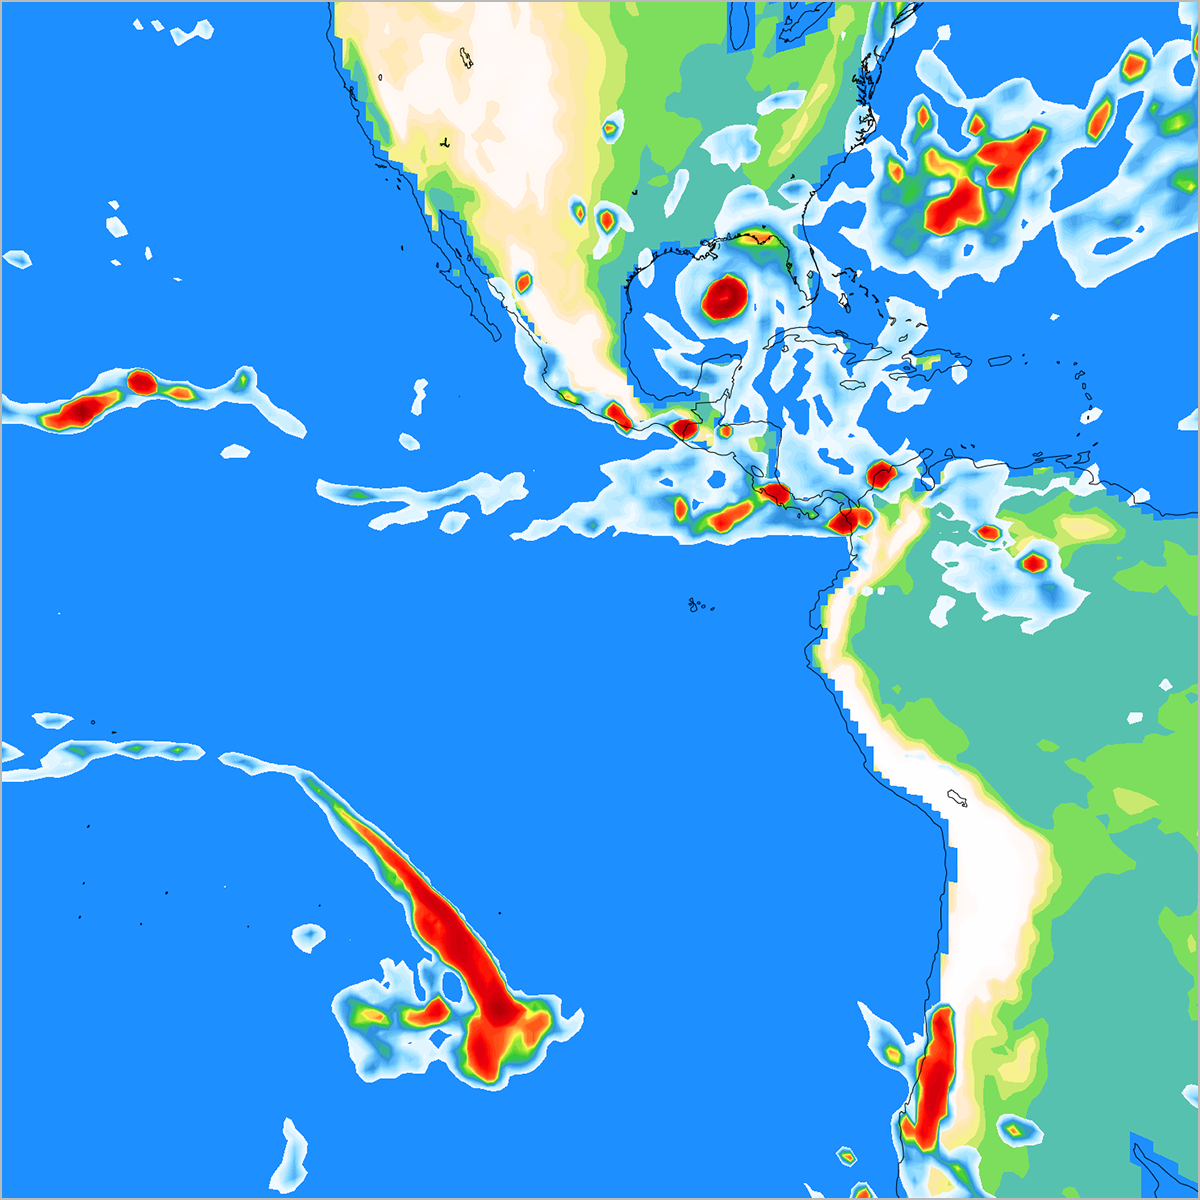
AMERICAS
Topography and total precipitation for August 28, 2005. Very high precipitation amounts (shown in reds) can be seen in Hurricane Katrina located in the Gulf of Mexico. Katrina was responsible for the deaths of over 1,500 people, with damage estimates exceeding 100 billion dollars. North America experiences the world’s most extreme weather with hurricanes, tornadoes, droughts, floods, wildfires, blizzards, heat waves, severe storms, and derechos.
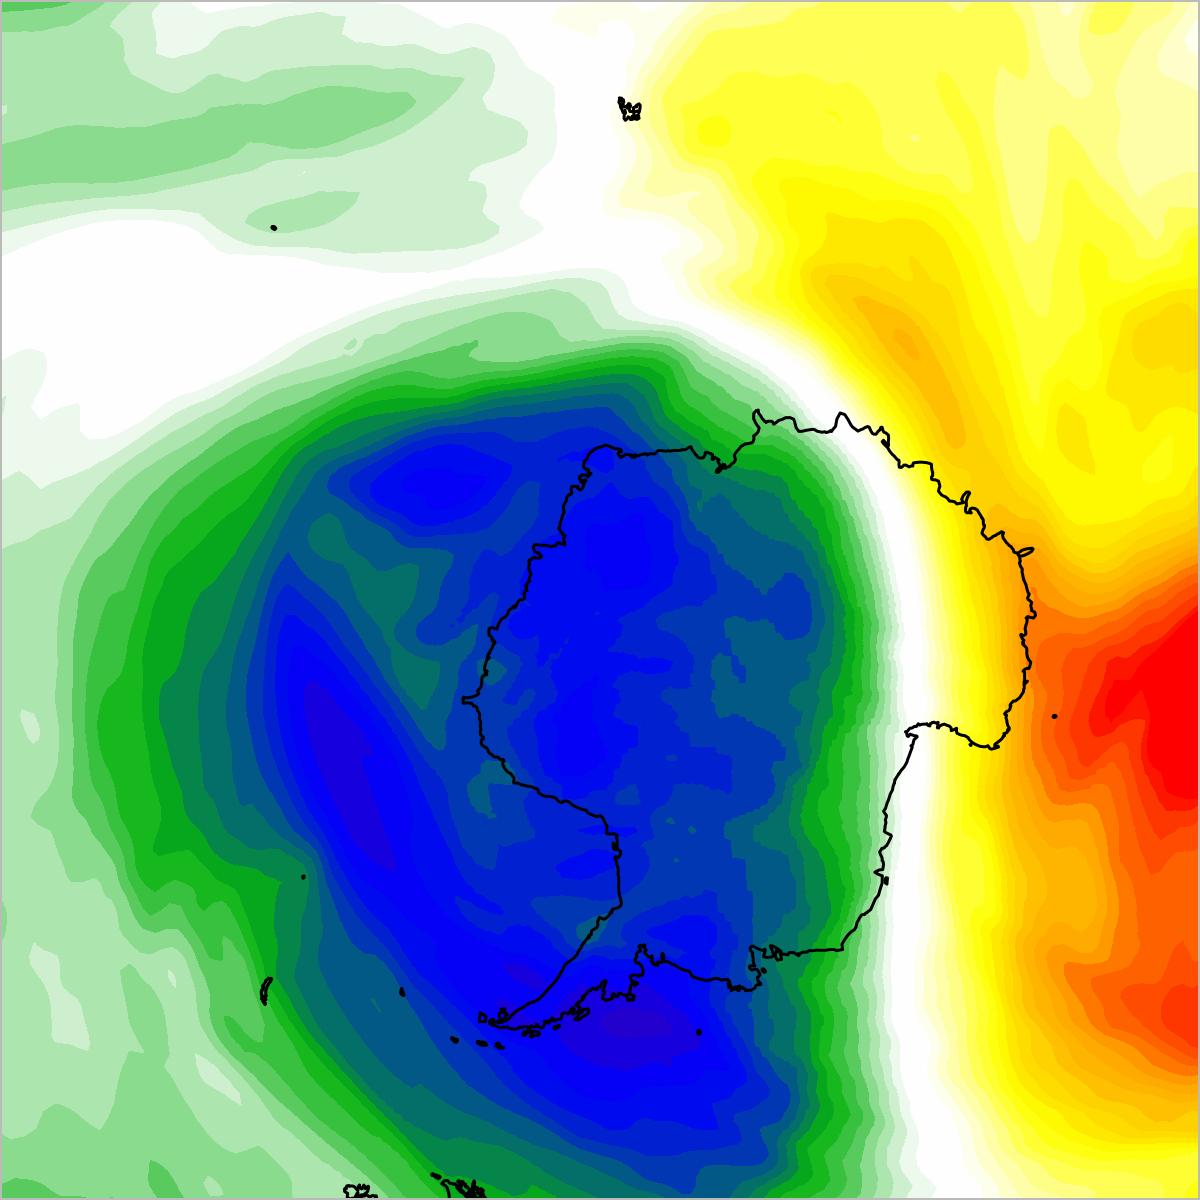
ANTARCTIC
Total column ozone for August 24, 2002. Blues indicate very low column-integrated ozone, while warmer colors indicate larger values. Total ozone is measured through the entire atmospheric column, from the surface of the Earth to the edge of space. Antarctica’s average maximum sea ice areal extent is around 7,260,000 square miles and its minimum is about 815,000 square miles. The ozone hole first appeared over Antarctica in 1984. The discovery lead to the 1987 Montreal Protocol.
Bonus Image
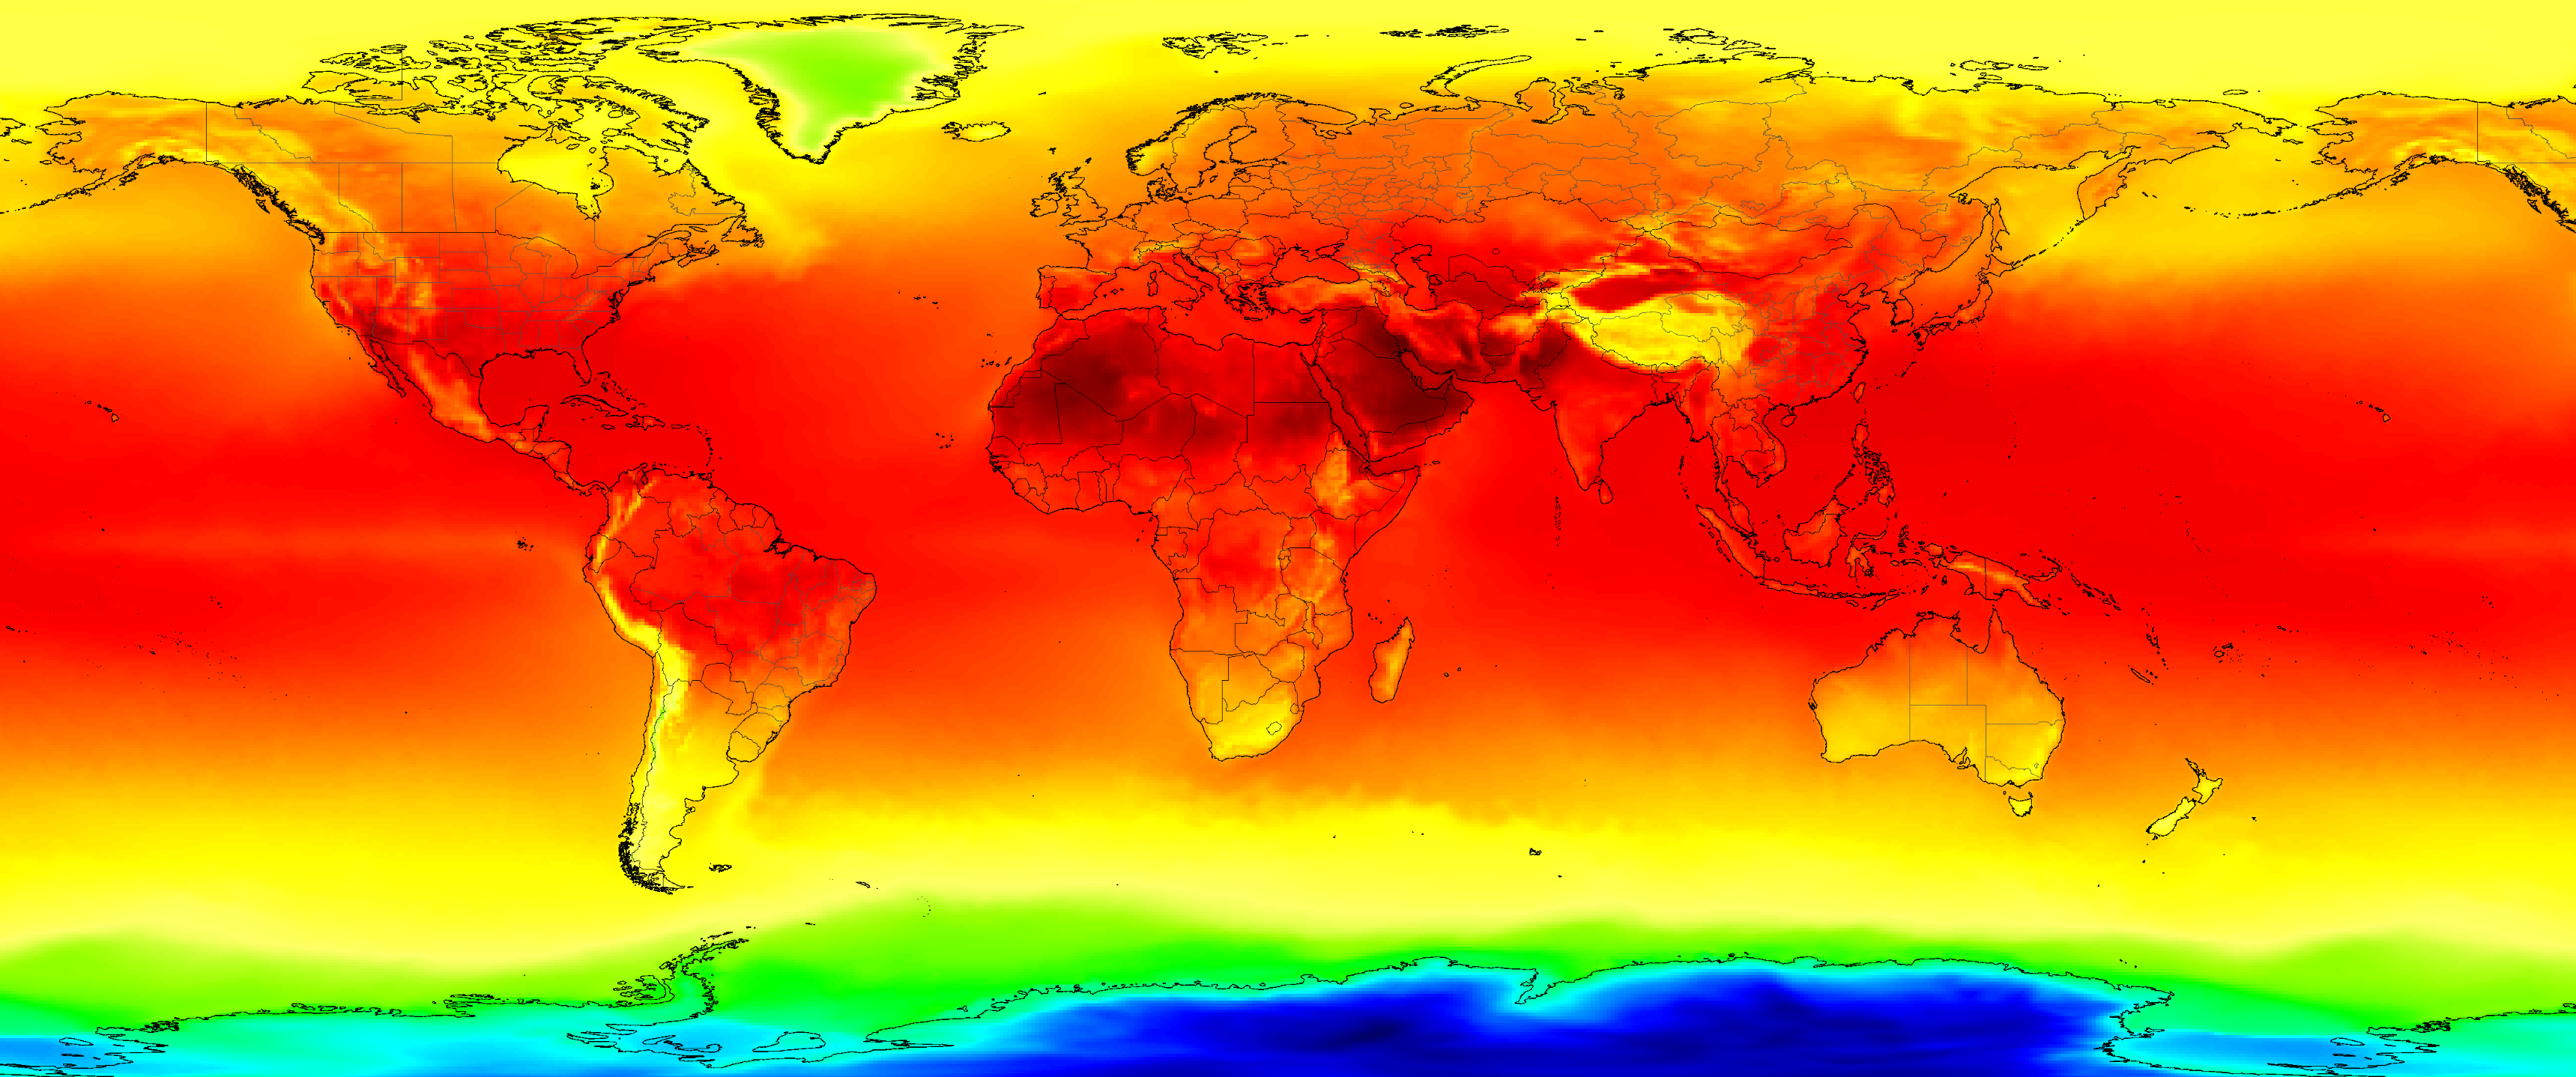
MERRA-2 atmospheric temperature at 650 hPa on July 12, 2016. Hectopascal (hPa) is a metric measurement unit of pressure. Pressure altitude is the height above a "standard datum plane", which is a theoretical level where the weight of the atmosphere is 1,013.2 millibars as measured by a barometer.