
Sensitivity of Tropical Cyclones to Parameterized Convection in the GEOS-5 Model
September 2014
Young-Kwon Lim, Siegfried D. Schubert, Oreste Reale, Andrea M. Molod, Max J. Suarez
This study aims to (1) identify the sensitivity of tropical cyclones (TCs) in general circulation models (GCMs) to the representation of convective rain processes and to determine the minimum horizontal grid resolution needed to obtain realistic TC activity and (2) explain the physical mechanisms by which the suppression of this convective rain process promotes TC activity. Convective cloud development for this convective rain process generally occurs on smaller scales than the horizontal grid size of GCMs. This process is thus, usually represented by a parameterized model rather than being explicitly resolved.
Recent work has found that GCMs with horizontal resolutions of 50km or coarser do not represent TCs very realistically. Walsh et al (2013) found that many such GCMs greatly underestimate TC activity over the North Atlantic (but not the North Pacific). Strachan et al. (2013) showed that these GCMs do not simulate TCs with realistic intensity or spatial structure, with typically weak and poorly organized systems. This suggests that higher resolution is needed to better representation the more intense storms, including various aspects of storm development such as a better simulation of African easterly waves and the associated strong low-level vorticity. Prior studies also suggested that more realistic TC simulations depend on improvements to the representation of convection (Reed and Jablonowski 2011; Zhao et al. 2012). This study demonstrates that realistic TC activity can be simulated in GCMs with a resolution of about 25km is and that modifications to the convective parametrization can lead to further improvements in the realism of the TCs.
This work presents a case study that investigates two contrasting years (2005 and 2006) that were characterized by very active and inactive hurricane seasons. The GEOS-5 model study focused on the sensitivity to the cumulus entrainment rate (the Tokioka constraint) in a set of simulations run with 0.25° horizontal resolution. Three simulations were carried out for each year characterized by different Tokioka constraints. ExpA has the strongest Tokioka constraint, having the greatest possibility of large thresholds of minimum entrainment, while ExpB corresponds to an intermediate range of thresholds. ExpC, which is the baseline control run, has the lowest minimum entrainment range, allowing more parameterized deep convection relative to ExpA and ExpB. All simulations were carried out with prescribed weekly sea-surface temperature (SST) forcing, and were initialized from MERRA data on May 1 of each year.
The number of tropical storms and hurricanes detected for each year and each experiment is shown in Table 1. ExpA produces an excessive number of tropical storms and hurricanes compared with observations. In particular, it produces too much TC activity (more than 20 hurricanes) even during the relatively inactive year of 2006. In terms of overall TC paths, however, ExpA performs better than the other two experiments as it produces more realistic TC paths progressing to the mid-latitudes. ExpB produces more reasonable TC numbers, being closer to the observations than either ExpA or ExpC. ExpC shows generally weak TC activity and, in particular, generates substantially fewer TCs for the active hurricane season of 2005.
| ExpA | ExpB | ExpC (control run) |
Observation | |
|---|---|---|---|---|
| 2005 | 36 (24) | 25 (15) | 18 (8) | 29 (15) |
| 2006 | 27 (21) | 13 (8) | 8 (6) | 10 (5) |
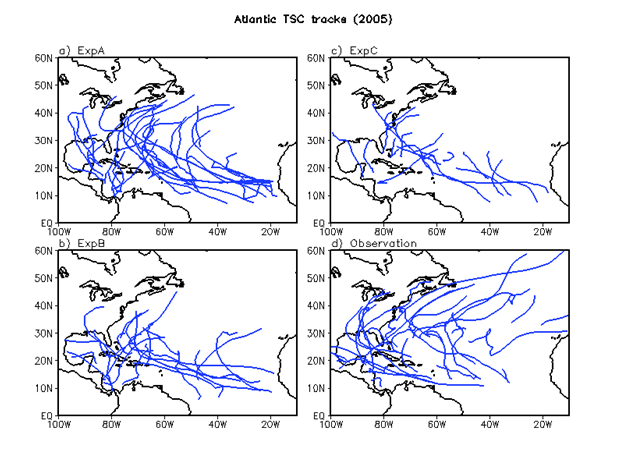
Figure 1 shows that during the 2005 season a variety of tracks were observed including: 1) Cape Verde-type TC systems that crossed the Atlantic making landfall over the American continent, 2) early recurvers, 3) Gulf of Mexico TCs, and 4) eastward tracking systems embedded in the westerlies. A comparison of the experiments shows that ExpA and ExpB both display a wide variety of tracks, similar to the observation, but ExpC did not. The results for 2006 are similar to those obtained for 2005, in the sense that the increased thresholds of minimum entrainment produce larger numbers of TCs with longer life cycles and a track variety that is closer to the observed (see Figure 3 in Lim et al. (2014)).
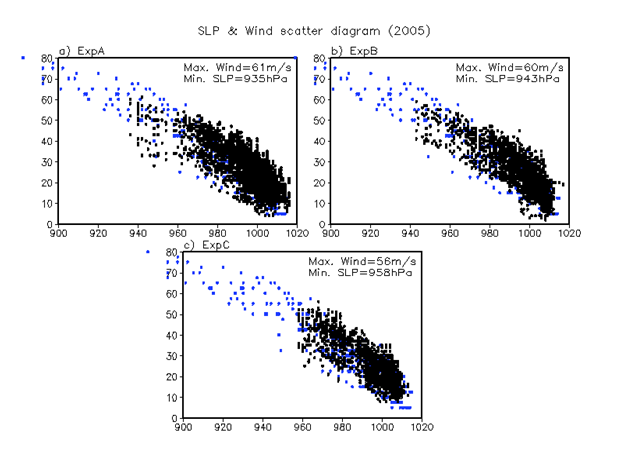
TC intensity is assessed in Figure 2 in terms of scatter plots of low-level (surface to 850hPa) wind versus sea level pressure (SLP) for 2005. The results show that the maximum wind speed is up to 61ms-1 in the ExpA, 60ms-1 in ExpB, and less than 60ms-1 in ExpC. The minimum SLP is down to 935, 943, and 958hPa, in ExpA, ExpB, and ExpC, respectively. ExpA and ExpB reveal improved distributions of SLP and wind speed compared with ExpC. Note however, that the observed wind speed is up to 80ms-1 and minimum SLP deeper than 920hPa for extremely strong hurricanes – something not reproduced by the model in any of the experiments. Much finer horizontal resolution (Putman and Suarez 2011) appears to be necessary for capturing such extremely strong hurricanes.
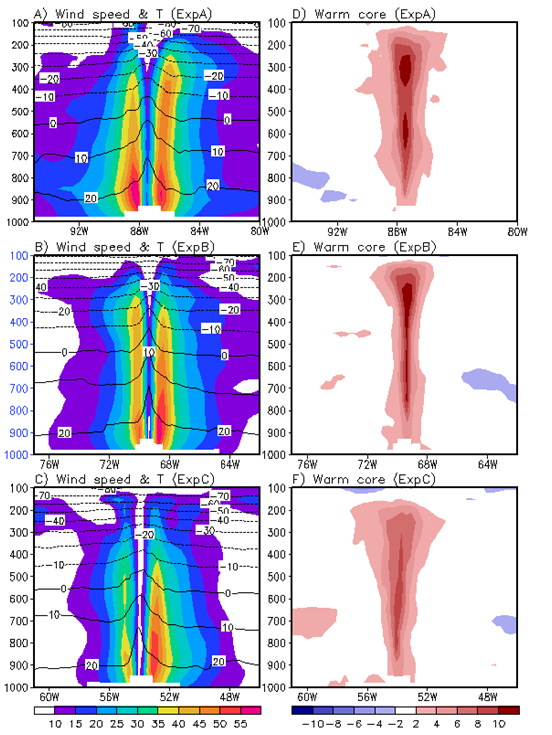
The vertical structure of the strongest hurricane for ExpA is plotted in Figs. 3a and 3d. The results for 2005 show a compact core and hurricane eye that is well defined. The maximum low level wind speeds (greater than 60ms-1) and the radius of maximum winds (less than 50km) are both quite realistic. Note that the maximum wind speed in Fig. 3a is not necessarily found on the eastern side of hurricane core as this hurricane is moving westward over Gulf of Mexico as it reaches its maximum intensity. The warm core value is greater than 10°C and situated in the upper-troposphere, quite similar to the typical structure of observed hurricanes. Compared with ExpA, the vertical structures of the strongest hurricanes in ExpB (Figs. 3b and 3e) are a little weaker, but still show a reasonable structure in terms of the compactness of the core, with the radius of the maximum wind less than ~50km (two grid points in the longitudinal direction). The maximum wind value near 60ms-1, the minimum SLP of about 940hPa, and vertical profile of the warm core reaching 10°C are produced. ExpC, which is the control run, also shows reasonable results (Figs. 3c and 3f), though the storms are less organized than those found in the other two experiments. Figures 2 and 3 provide compelling evidence that the suppression of parameterized deep convection tends to produce more intense hurricanes with better organized vertical structures.
The following examines the physical mechanisms by which the suppression of the cumulus parameterization promotes TC activity. The role of atmospheric moist static stability (MSE) – a factor known to affect TC characteristics is examined in Fig. 4. Here the vertical profile of moist static energy (Fig. 4a) and the vertical gradient of equivalent potential temperature (Fig. 4b) are computed over the TC genesis region, which covers most of the central and eastern tropical Atlantic (60°W-15°W, 5°N-20°N). Profiles from all experiments exhibit a decrease with height in MSE at low levels (below 700-800hPa height) and an increase with height at upper-levels, implying the possibility of conditional instability. The ExpA result shows the possibility of stronger instability than ExpB and ExpC. Figure 4b also shows that the lower tropospheric vertical column characterized by negative -∂θe/∂P is more extensive in ExpA than the other two experiments, indicating the most unstable atmosphere occurs in ExpA, followed by ExpB and ExpC.
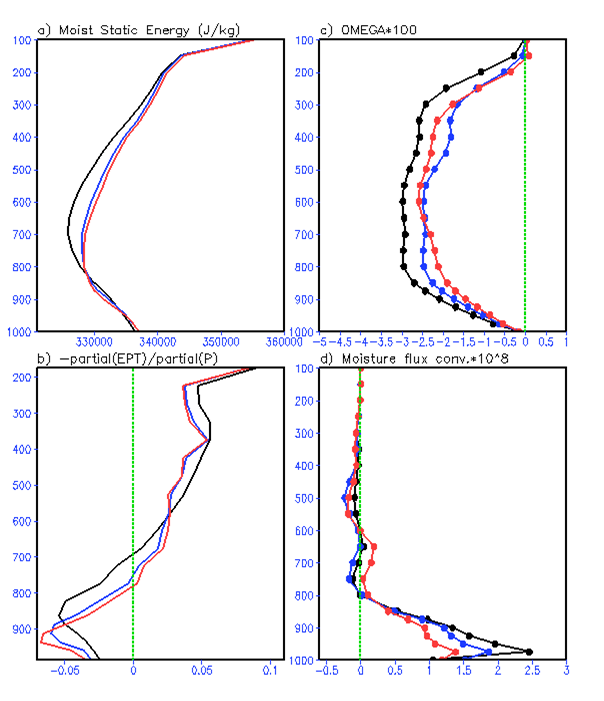
Figure 4c clearly illustrates the strong response of the vertical motion to the unstable atmosphere. The increase in atmospheric instability over the TC genesis region leads to increased ascending motion throughout the vertical column with the largest increase occurring in ExpA, followed by ExpB and then ExpC. The enhanced vertical ascent and associated low-level convergence, combined with low-level moistening and positive latent heat flux, plays a role in increasing the moisture flux convergence at low levels (Fig. 4d), with the largest values again occurring in ExpA, followed by ExpB and ExpC.
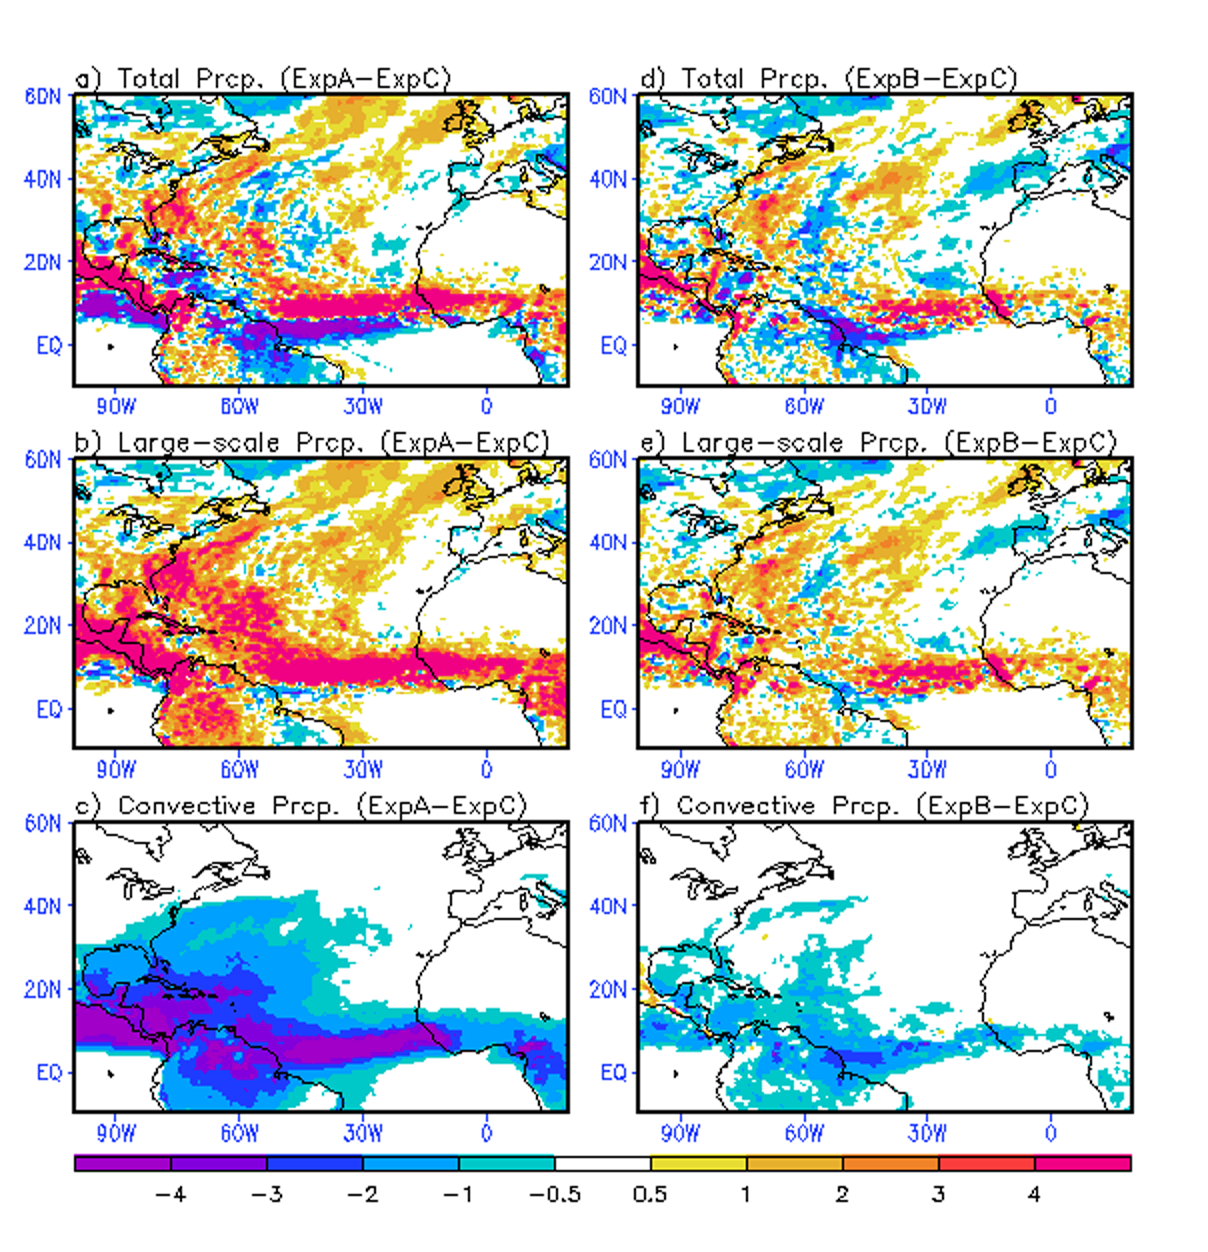
An important consideration is whether the above modifications in the convective parameterization produce detrimental changes in the atmospheric mean state and its variability (e.g., seasonal cycle). Figure 5 shows the differences between each experiment in the mean precipitation for 2005. Here, both the large-scale precipitation and convective precipitation are plotted to indentify the fractional precipitation changes. The results show that both total and large-scale precipitation increase noticeably over the tropics for ExpA, whereas there is a substantial reduction in convective precipitation (left panels). In contrast, for ExpB (the right panels) there is only a very small change in total precipitation over the tropics (Fig. 5d), while the large-scale precipitation over the TC genesis region increases slightly (Fig. 5e) along with a decrease in convective precipitation (Fig. 5f). This fractional precipitation change is due to an increased grid-scale cloud/condensation (i.e., large-scale precipitation) along with a suppression of parameterized deep convection (i.e., convective precipitation) (Reed and Jablonowski 2011).
click for larger image
In summary, this study found that a modest reduction in the contribution of deep convective cloud processes in the model run at 0.25 degree horizontal resolution improves TC activity (e.g., TC number, intensity, life cycle and spatial structure) to more realistic levels. A reduction in deep convective cloud processes leads to a moister lower troposphere and drier and cooler upper troposphere, leading to a more unstable atmosphere. This instability provides an environment that is more conducive to TC vortex development and upward moisture flux convergence by dynamically resolved moist convection, thereby increasing TC activity.
Further details about this work can be found in Lim et al. (2014).
References:
Lim, Y.-K., S. D. Schubert, O. Reales, M.-Y. Lee, A. M. Molod, and M. J. Suarez, 2014. Sensitivity of tropical cyclones to parameterized convection in the NASA GEOS5 model. Revision under review J. Climate.
Putman, W. M., and M. Suarez, 2011: Cloud-system resolving simulations with the NASA Goddard Earth Observing System global atmospheric model (GEOS-5). Geophys. Res. Lett., 38, L16809, doi:10.1029/2011GL048438.
Reed, K. A., and C. Jablonowski, 2011: Impact of physical parameterizations on idealized tropical cyclones in the Community Atmosphere Model. Geophys. Res. Lett., 38, L04805, doi:10.1029/2010GL046297.
Strachan, J., P.-L. Vidale, K. Hodges, M. Roberts, and M.-E. Demory, 2013: Investigating global tropical cyclone activity with a hierarchy of AGCMs: The role of model resolution. J. Climate, 26, 133–152, doi:10.1175/JCLI-D-12-00012.1.
Walsh, K., S. Lavender, E. Scoccimarro, and H. Murakami, 2013: Resolution dependence of tropical cyclone formation in CMIP3 and finer resolution models. Clim. Dyn., 40, 585-599, doi:10.1007/s00382-012-1298-z.
Zhao, M., I. M. Held, and S.-J. Lin, 2012: Some counter-intuitive dependencies of tropical cyclone frequency on parameters in a GCM. J. Atmos. Sci., 69, 2272-2283, doi:10.1175/JAS-D-11-0238.1.